Learning Kubernetes with KubeADM - Part 4: Implementing Istio Service Mesh
Part 4 of our series on learning Kubernetes with kubeadm where we implement Istio service mesh to add advanced traffic management, security policies, and observability to our microservices architecture.

Welcome back to our series on learning Kubernetes with KubeADM! In Part 3, we successfully deployed Google’s Online Boutique microservices application to our homelab cluster. This gave us a realistic multi-service architecture with 11 interconnected microservices written in different programming languages, communicating over gRPC and showcasing modern cloud-native design patterns.
Now we’re ready to take our microservices architecture to the next level by implementing Istio service mesh. While our Online Boutique application currently runs well, it lacks the advanced traffic management, security policies, and deep observability that production environments require. Service mesh technology addresses these challenges by providing a dedicated infrastructure layer that handles service-to-service communication transparently.
Istio is the leading service mesh solution that transforms how microservices communicate, secure, and observe each other. By deploying Istio alongside our existing Online Boutique application, we’ll gain powerful capabilities including intelligent traffic routing, mutual TLS encryption, advanced observability with distributed tracing, and fine-grained security policies—all without modifying a single line of application code.
In this tutorial, we’ll install Istio using Helm, configure it for our cluster, inject sidecar proxies into our Online Boutique services, and explore the advanced features that make service mesh essential for production microservices architectures. You’ll learn how to implement traffic management policies, security controls, and observability that would be extremely difficult to achieve with traditional Kubernetes networking alone.
By the end of this guide, you’ll have a fully functional service mesh deployment that provides enterprise-grade microservices capabilities, preparing you for advanced scenarios like canary deployments, circuit breakers, and zero-trust security models.
You can find all the code examples and configuration files in our GitHub repository.
Prerequisites and Current State
Before we begin implementing Istio, let’s add two more worker nodes to our cluster. Then we’ll verify that our cluster is healthy and that our Online Boutique application is running correctly. This tutorial builds directly on the infrastructure we established in the previous parts, so all components should be operational.
Adding Worker Nodes
Because we automated the process of deploying virtual-machines using our create-vms.sh script, adding two more worker nodes is straightforward:
- On your host workstation, make a copy of
create-vms.shand modify theVM_NAMESandVM_IPSlines to add 2 more worker nodes:
cp create-vms.sh test.sh && \
sed -i 's/^VM_NAMES=.*$/VM_NAMES=("worker-3" "worker-4")/g; s/^VM_IPS=.*$/VM_IPS=("192.168.122.104\/24" "192.168.122.105\/24")/g' test.sh- Use scp to copy the
all-nodes.shscript to each new node:
scp all-nodes.sh [email protected]:/home/ubuntu
scp all-nodes.sh [email protected]:/home/ubuntu- Run the
all-nodes.shscript on each nodee:
ssh [email protected] "sh all-nodes.sh"
ssh [email protected] "sh all-nodes.sh"- Generate a token on
master-1to join the cluster:
sudo kubeadm token create --print-join-command- Run the join command you just retrieved on each node.
Now, confirm that the two new worker nodes have joined the cluster and are ready:
kubectl get nodesVerify Cluster Health
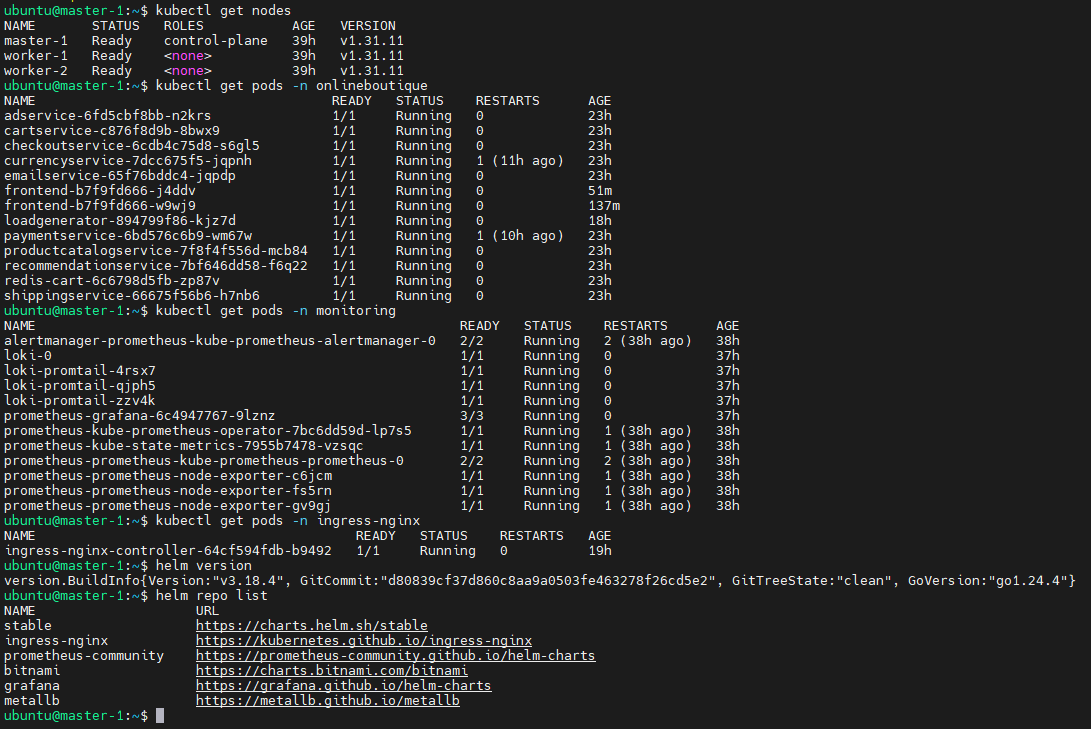
SSH into your master-1 node and run these verification commands:
# Verify all nodes are ready
kubectl get nodes

# Check that Online Boutique is running
kubectl get pods -n onlineboutique

# Verify monitoring stack is operational
kubectl get pods -n monitoring

# Confirm ingress controller is running
kubectl get pods -n ingress-nginx

# Check that Helm is available and repositories are configured
helm version
helm repo list
You should see output confirming:
- All three nodes (master-1, worker-1, worker-2) are in “Ready” status
- Online Boutique pods are running and ready in the
onlineboutiquenamespace - Monitoring stack (Prometheus, Grafana, Loki) is operational
- NGINX Ingress Controller is running
- Helm v3.x is installed with the necessary repositories
If any components are missing or not functioning properly, please refer back to the previous parts of this series to complete the setup before proceeding.
Understanding Service Mesh Architecture
Before diving into the installation, it’s important to understand what we’re implementing. A service mesh is an infrastructure layer that handles service-to-service communication in a microservices architecture. Rather than requiring each service to implement its own communication, security, and observability logic, the service mesh provides these capabilities through a network of lightweight proxies.
Core Components of Istio:
Data Plane: Consists of sidecar proxies (based on Envoy) that are deployed alongside each service instance. These proxies intercept all network traffic to and from the service, providing features like load balancing, circuit breaking, encryption, and telemetry collection.
Control Plane: The central management layer that configures and manages the sidecar proxies. This includes:
- Istiod: The main control plane component that handles configuration, service discovery, and certificate management
- Pilot: Service discovery and traffic management
- Citadel: Identity and security management
- Galley: Configuration management and validation
Key Benefits for Our Online Boutique Application:
- Traffic Management: Intelligent routing, load balancing, and failover without code changes
- Security: Mutual TLS encryption between services and fine-grained access control
- Observability: Distributed tracing, metrics, and logging for all service interactions
- Resilience: Circuit breakers, timeouts, and retry policies to handle failures gracefully
This architecture allows us to add sophisticated networking capabilities to our existing microservices without modifying the application code, making it perfect for our already-deployed Online Boutique application.
Objective 1: Installing Istio Service Mesh
First, download istioctl:
# Download istioctl
curl -L https://istio.io/downloadIstio | sh -

# cd into the istio directory (version may change)
cd istio-1.22.3/

# Add istioctl to path
export PATH=$PWD/bin:$PATH
Now, use istioctl to install Istio:
istioctl install --set profile=default -y

# Verify it installed
kubectl get pods -n istio-system
Now, create the Ingress Gateway and Virtual Service for our Online Boutique application:
cat <<EOF | kubectl apply -f -
apiVersion: networking.istio.io/v1beta1
kind: Gateway
metadata:
  name: onlineboutique-gateway
  namespace: onlineboutique
spec:
  selector:
    istio: ingressgateway
  servers:
  - port:
      number: 80
      name: http
      protocol: HTTP
    hosts:
    - "*"
---
apiVersion: networking.istio.io/v1beta1
kind: VirtualService
metadata:
  name: onlineboutique-vs
  namespace: onlineboutique
spec:
  hosts:
  - "*"
  gateways:
  - onlineboutique-gateway
  http:
  - route:
    - destination:
        host: frontend-external
        port:
          number: 80
EOF
# Verify the VirtualService was created
kubectl get svc -n istio-systemVerify Istio Installation
Let’s confirm that the control plane is running correctly:
# Check that istiod is running
kubectl get deployments -n istio-system

# Verify istiod pods are ready
kubectl get pods -n istio-system

# Check istiod service
kubectl get svc -n istio-system
You should see output showing:
- The istiod deployment is ready (1/1 available replicas)
- The istiod pod is running and ready
- The istiod service is available on port 15010
# Verify Istio CRDs are available
kubectl get crd | grep istio | wc -l

# Check Istio configuration
kubectl get mutatingwebhookconfiguration | grep istio
kubectl get validatingwebhookconfiguration | grep istio
If everything is working correctly, you should see:
- All pods in istio-system and istio-ingress namespaces are running
- Multiple Istio CRDs are installed (typically 10-20+ CRDs)
- Istio webhook configurations are present for sidecar injection
Your Istio service mesh is now installed and ready to manage microservices communication. In the next objective, we’ll configure automatic sidecar injection for our Online Boutique application.
Objective 2: Configuring Sidecar Injection for Online Boutique
Now that Istio is installed, we need to configure it to manage our Online Boutique application. This involves enabling automatic sidecar injection for the namespace and restarting the application pods so they include the Istio sidecar proxies.
Understanding Sidecar Injection
Sidecar injection is the process by which Istio automatically adds an Envoy proxy container to each pod in your application. This sidecar proxy intercepts all network traffic to and from the application container, providing service mesh capabilities without requiring code changes.
There are two methods for sidecar injection:
- Automatic Injection: Enabled by labeling namespaces, causing all new pods to receive sidecars
- Manual Injection: Applied to specific deployments using
istioctl kube-inject
We’ll use automatic injection, which is the recommended approach for production environments.
Enabling Automatic Sidecar Injection
First, let’s label the onlineboutique namespace to enable automatic sidecar injection:
# Label the namespace for automatic sidecar injection
kubectl label namespace onlineboutique istio-injection=enabled

# Verify the label was applied
kubectl get namespace onlineboutique --show-labels
You should see output showing the istio-injection=enabled label on the namespace.
Restarting Online Boutique Pods
Since our Online Boutique application was deployed before Istio was installed, the existing pods don’t have sidecar proxies. We need to restart all pods in the namespace to trigger sidecar injection:
# Check current pod status (should show 1/1 ready)
kubectl get pods -n onlineboutique

# Restart all deployments to trigger sidecar injection
kubectl rollout restart deployment -n onlineboutique

# Watch the rollout progress
kubectl rollout status deployment -n onlineboutique --timeout=600s
The restart process will take several minutes as each pod is recreated with the Istio sidecar container.
Verifying Sidecar Injection
Let’s verify that the sidecar injection was successful:
# Check pod status - should now show 2/2 ready (app container + sidecar)
kubectl get pods -n onlineboutique

# Get detailed information about a specific pod
kubectl describe pod -n onlineboutique -l app=frontend

# Check container count in a pod
kubectl get pod -n onlineboutique -l app=frontend -o jsonpath='{.items[0].spec.containers[*].name}'
You should see:
- All pods now show “2/2” ready status (application container + istio-proxy sidecar)
- The pod description includes both the application container and the
istio-proxycontainer - Container names include both the application and
istio-proxy
Examining Sidecar Configuration
Let’s look at the sidecar configuration that was automatically injected:
# View the istio-proxy container configuration
kubectl get pod -n onlineboutique -l app=frontend -o jsonpath='{.items[0].spec.containers[1]}' | jq .

# Check sidecar resource usage
kubectl top pods -n onlineboutique --containers | grep istio-proxy
The sidecar proxy runs alongside each application container, consuming minimal resources while providing comprehensive service mesh capabilities.
Examining Service Mesh Traffic
With sidecars injected, we can now observe the service mesh traffic patterns:
# View the service mesh configuration
kubectl get virtualservices -n onlineboutique
kubectl get destinationrules -n onlineboutique
kubectl get gateways -n onlineboutique

# Check Istio proxy logs for a specific service
kubectl logs -n onlineboutique -l app=frontend -c istio-proxy | tail -20
At this point, you should see minimal service mesh configuration since we haven’t yet created specific traffic management rules. The sidecar proxies are operating in a “pass-through” mode, forwarding traffic while collecting telemetry data.
Your Online Boutique application is now running within the Istio service mesh, with each service protected and monitored by sidecar proxies. In the next objective, we’ll configure traffic management policies to demonstrate the advanced capabilities of the service mesh.
Objective 3: Implementing Traffic Management with Istio
Now that our Online Boutique application is running with Istio sidecar proxies, we can implement sophisticated traffic management policies. This is where the real power of service mesh becomes apparent, we can control how traffic flows between services, implement advanced deployment strategies, and add resilience patterns without modifying application code.
Understanding Istio Traffic Management
Istio provides several key resources for traffic management:
- VirtualService: Defines traffic routing rules, including path-based routing, header-based routing, and traffic splitting for canary deployments.
- DestinationRule: Configures service-level policies like load balancing, connection pooling, and circuit breakers.
- Gateway: Manages ingress traffic entering the mesh from external clients.
- ServiceEntry: Registers external services to bring them into the mesh.
Let’s start by creating a gateway to properly expose our Online Boutique application.
Creating an Istio Gateway
An Istio Gateway is a Kubernetes resource that defines how external traffic enters your service mesh. In this tutorial, the gateway is used to expose our Online Boutique application to traffic from outside the cluster.
- The Istio ingress gateway is a special Envoy proxy that receives external traffic. You configure it with an Istio Gateway resource (like the YAML below) to specify ports, protocols, and hostnames.
- The Load Balancer (MetalLB in our case) assigns an external IP to the Istio ingress gateway’s Kubernetes service, making it reachable from outside our cluster.
- The Istio Gateway resource tells the ingress gateway how to handle incoming traffic (e.g., accept HTTP on port 80 for boutique.local).
First, let’s verify the correct selector for our Istio ingress gateway:
# Check the labels on the Istio ingress gateway pod
kubectl get pods -n istio-system --show-labels

# Check the gateway service selector
kubectl describe svc -n istio-system istio-ingressgateway
Based on the pod labels, we can see that our ingress gateway has the label istio=ingressgatway. Now let’s create the correct gateway configuration:
# Create a gateway configuration that matches our Istio ingress gateway
cat <<EOF | kubectl apply -f -
apiVersion: networking.istio.io/v1beta1
kind: Gateway
metadata:
  name: onlineboutique-gateway
  namespace: onlineboutique
spec:
  selector:
    istio: ingressgateway
  servers:
  - port:
      number: 80
      name: http
      protocol: HTTP
    hosts:
    - "boutique.homelab.local"
EOF
Now check the service:
kubectl get svc -n istio-systemCreating VirtualService for Traffic Routing
Now we’ll create a VirtualService that routes traffic from the gateway to our frontend service:
# Create a VirtualService for the frontend
cat <<EOF | kubectl apply -f -
apiVersion: networking.istio.io/v1beta1
kind: VirtualService
metadata:
  name: onlineboutique-vs
  namespace: onlineboutique
spec:
  hosts:
  - "*"
  gateways:
  - onlineboutique-gateway
  http:
  - route:
    - destination:
        host: frontend-external
        port:
          number: 80
EOF
Testing the Istio Gateway
Now let’s test that our Istio Gateway is working correctly:
# First, verify the gateway and virtualservice were created
kubectl get gateway -n onlineboutique
kubectl get virtualservice -n onlineboutique

# Check if the Istio ingress gateway is ready
kubectl get pods -n istio-system

# Test through the Istio gateway using the MetalLB IP (Or whatever public IP has been assigned)
curl -H "Host: boutique.homelab.local" http://192.168.122.202 | grep -i "online boutique"
Implementing Advanced Traffic Policies
Let’s implement some advanced traffic management policies to demonstrate Istio’s capabilities:
Adding Timeout and Retry Policies
Timeout and retry policies in Istio help control how requests are handled between services, improving reliability and resilience:
- Timeout Policy: Sets a maximum time for a request to complete. If the service doesn’t respond within this period, Istio ends the request, preventing clients from waiting indefinitely. This helps avoid cascading failures and improves user experience.
- Retry Policy: Automatically retries failed requests a specified number of times before giving up. This is useful for handling transient errors, such as temporary network issues or brief service outages, increasing the chance of successful responses.
In Istio, these policies are typically defined in VirtualService resources, but DestinationRule can also influence connection behavior (like pool settings and outlier detection). Together, they help ensure your microservices communicate reliably, even in the face of failures or slow responses.
# Create a DestinationRule with timeout and retry policies
cat <<EOF | kubectl apply -f -
apiVersion: networking.istio.io/v1beta1
kind: DestinationRule
metadata:
  name: productcatalogservice-dr
  namespace: onlineboutique
spec:
  host: productcatalogservice
  trafficPolicy:
    connectionPool:
      tcp:
        maxConnections: 10
      http:
        http1MaxPendingRequests: 10
        maxRequestsPerConnection: 2
    outlierDetection:
      # This field replaces the deprecated 'consecutiveErrors'
      consecutive5xxErrors: 5
      interval: 30s
      baseEjectionTime: 30s
EOF
Creating a Circuit Breaker Pattern
The circuit breaker pattern in Istio helps improve the resilience of microservices by preventing your application from repeatedly trying to connect to unhealthy services. When Istio detects consecutive errors from a service (like recommendationservice), it temporarily “ejects” that service from the load balancer pool. This means requests are not sent to the failing service for a set period (baseEjectionTime), allowing it time to recover.
- connectionPool: Limits the number of simultaneous connections and pending requests, reducing overload risk.
- outlierDetection: Monitors service health. If a service has too many errors (
consecutiveErrors), Istio stops sending traffic to it for a while.
# Create a more sophisticated DestinationRule with circuit breaker
cat <<EOF | kubectl apply -f -
apiVersion: networking.istio.io/v1beta1
kind: DestinationRule
metadata:
  name: recommendationservice-dr
  namespace: onlineboutique
spec:
  host: recommendationservice
  trafficPolicy:
    connectionPool:
      tcp:
        maxConnections: 1
      http:
        http1MaxPendingRequests: 1
        maxRequestsPerConnection: 1
    outlierDetection:
      # This field replaces the deprecated 'consecutiveErrors'
      consecutive5xxErrors: 1
      interval: 1s
      baseEjectionTime: 3m
      maxEjectionPercent: 100
EOF
Testing Traffic Management
Now let’s test our traffic management configuration:
# Check that our Istio resources were created
kubectl get gateway -n onlineboutique
kubectl get virtualservice -n onlineboutique
kubectl get destinationrule -n onlineboutique

# Verify the Istio ingress gateway service has an external IP
kubectl get svc -n istio-system
You should see the istio-system service with an external IP assigned by MetalLB (like 192.168.122.202).
Now we can test access:
First, update your host machine’s /etc/hosts file to point to the MetalLB IP:
# On your host machine, replace with your actual MetalLB external IP
echo "192.168.122.202 boutique.homelab.local" | sudo tee -a /etc/hosts
Then test directly:
# Test from your host machine or from within the cluster
curl http://boutique.homelab.local | grep -i "online boutique"
Implementing Traffic Splitting (Canary Deployment)
One of the most powerful features of service mesh is the ability to implement canary deployments with traffic splitting. Let’s create a scenario where we split traffic between different versions of a service.
For demonstration purposes, let’s create a simple traffic split for the frontend service:
# Update the VirtualService to implement traffic splitting
cat <<EOF | kubectl apply -f -
apiVersion: networking.istio.io/v1beta1
kind: VirtualService
metadata:
  name: onlineboutique-frontend
  namespace: onlineboutique
spec:
  hosts:
  # This should match the host in your Gateway
  - "boutique.homelab.local"
  gateways:
  - onlineboutique-gateway
  http:
  - match:
    - uri:
        prefix: "/"
    route:
    - destination:
        host: frontend
        port:
          number: 80
      weight: 100
    fault:
      delay:
        percentage:
          value: 10
        fixedDelay: 5s
EOF
This configuration introduces a 5-second delay to 10% of requests, simulating network latency and demonstrating fault injection capabilities.
Monitoring Traffic Flow
Let’s examine how traffic flows through our service mesh:
# Check the proxy configuration
kubectl exec -n onlineboutique deployment/frontend -c istio-proxy -- curl -s localhost:15000/config_dump | head -20

# View cluster information
kubectl exec -n onlineboutique deployment/frontend -c istio-proxy -- curl -s localhost:15000/clusters | head -20

# Check listener configuration
kubectl exec -n onlineboutique deployment/frontend -c istio-proxy -- curl -s localhost:15000/listeners | head -20
These commands provide insight into how the Envoy proxy is configured and how it’s handling traffic routing.
Validating Traffic Policies
Let’s test our circuit breaker configuration by generating some load:
# Generate some load to test circuit breaker
kubectl exec -n onlineboutique deployment/frontend -- \
  sh -c 'for i in $(seq 1 10); do curl -s http://recommendationservice:8080/recommendations?user_id=test; done'

# Check proxy stats to see circuit breaker in action
kubectl exec -n onlineboutique deployment/frontend -c istio-proxy -- \
  curl -s localhost:15000/stats | grep -i circuit
This demonstrates how Istio can protect services from being overwhelmed by implementing circuit breaker patterns automatically.
With traffic management policies in place, our Online Boutique application now benefits from advanced routing capabilities, fault tolerance, and traffic control. In the next objective, we’ll implement security policies to secure service-to-service communication.
Objective 4: Implementing Security Policies
Security is one of the most compelling features of Istio service mesh. By default, Istio provides automatic mutual TLS (mTLS) encryption between services, but we can implement additional security policies to create a zero-trust network model. Let’s configure authentication and authorization policies for our Online Boutique application.
Understanding Istio Security
Istio security operates on several levels:
Automatic mTLS: All service-to-service communication is automatically encrypted using certificates managed by Istio.
Authentication Policies: Define who can access your services using JWT tokens, mutual TLS, or other authentication methods.
Authorization Policies: Control what authenticated users can do, implementing fine-grained access control.
Security Policies: Define security requirements at the workload, namespace, or mesh level.
Verifying Automatic mTLS
First, let’s verify that automatic mTLS is working between our services:
# Check mTLS status for all services
kubectl exec -n onlineboutique deployment/frontend -c istio-proxy -- \
  curl -s localhost:15000/stats | grep ssl

# Check certificate information
kubectl exec -n onlineboutique deployment/frontend -c istio-proxy -- \
  curl -s localhost:15000/certs | head -20
You should see SSL/TLS statistics indicating that secure communication is happening between services.
Creating a Default Deny Authorization Policy
Let’s implement a zero-trust security model by creating a default deny policy and then explicitly allowing necessary communication:
# Create a default deny policy for the entire namespace
cat <<EOF | kubectl apply -f -
apiVersion: security.istio.io/v1beta1
kind: AuthorizationPolicy
metadata:
  name: default-deny
  namespace: onlineboutique
spec:
  # Empty spec means deny all
EOF
This policy denies all traffic by default. Now let’s test that our application is blocked:
# Test application access (should fail)
kubectl exec -n onlineboutique deployment/frontend -- \
  curl -s http://productcatalogservice:3550/products --max-time 5 || echo "Access denied as expected"
Creating Allow Policies for Service Communication
Now we’ll create specific allow policies for the services that need to communicate:
# Allow frontend to access productcatalogservice
cat <<EOF | kubectl apply -f -
apiVersion: security.istio.io/v1beta1
kind: AuthorizationPolicy
metadata:
  name: frontend-to-productcatalog
  namespace: onlineboutique
spec:
  selector:
    matchLabels:
      app: productcatalogservice
  action: ALLOW
  rules:
  - from:
    - source:
        principals: ["cluster.local/ns/onlineboutique/sa/default"]
    to:
    - operation:
        methods: ["GET", "POST"]
EOF
Let’s create additional policies for other critical service communications:
# Allow frontend to access currencyservice
cat <<EOF | kubectl apply -f -
apiVersion: security.istio.io/v1beta1
kind: AuthorizationPolicy
metadata:
  name: frontend-to-currency
  namespace: onlineboutique
spec:
  selector:
    matchLabels:
      app: currencyservice
  action: ALLOW
  rules:
  - from:
    - source:
        principals: ["cluster.local/ns/onlineboutique/sa/default"]
    to:
    - operation:
        methods: ["GET", "POST"]
EOF
# Allow frontend to access cartservice
cat <<EOF | kubectl apply -f -
apiVersion: security.istio.io/v1beta1
kind: AuthorizationPolicy
metadata:
name: frontend-to-cart
namespace: onlineboutique
spec:
selector:
matchLabels:
app: cartservice
action: ALLOW
rules:
- from:
- source:
principals: ["cluster.local/ns/onlineboutique/sa/default"]
to:
- operation:
methods: ["GET", "POST"]
EOFImplementing Method-Level Security
Let’s create more granular policies that control specific HTTP methods:
# Create a policy that only allows specific operations
cat <<EOF | kubectl apply -f -
apiVersion: security.istio.io/v1beta1
kind: AuthorizationPolicy
metadata:
  name: checkoutservice-policy
  namespace: onlineboutique
spec:
  selector:
    matchLabels:
      app: checkoutservice
  action: ALLOW
  rules:
  - from:
    - source:
        principals: ["cluster.local/ns/onlineboutique/sa/default"]
    to:
    - operation:
        methods: ["POST"]
        paths: ["/hipstershop.CheckoutService/PlaceOrder"]
EOF
Creating Service-Specific Service Accounts
For better security, let’s create dedicated service accounts for our services:
# Create service accounts for different services
kubectl create serviceaccount frontend-sa -n onlineboutique
kubectl create serviceaccount productcatalog-sa -n onlineboutique
kubectl create serviceaccount checkout-sa -n onlineboutique
Now let’s update one of our deployments to use the dedicated service account:
# Update the frontend deployment to use the dedicated service account
kubectl patch deployment frontend -n onlineboutique \
  -p '{"spec":{"template":{"spec":{"serviceAccountName":"frontend-sa"}}}}'

# Wait for the rollout to complete
kubectl rollout status deployment/frontend -n onlineboutique
Implementing Request-Level Authorization
Let’s create a more sophisticated authorization policy that controls access based on request attributes:
# Create a policy that allows access based on request headers
cat <<EOF | kubectl apply -f -
apiVersion: security.istio.io/v1beta1
kind: AuthorizationPolicy
metadata:
  name: header-based-access
  namespace: onlineboutique
spec:
  selector:
    matchLabels:
      app: recommendationservice
  action: ALLOW
  rules:
  - from:
    - source:
        principals: ["cluster.local/ns/onlineboutique/sa/default"]
    to:
    - operation:
        methods: ["GET", "POST"]
    when:
    - key: request.headers[user-agent]
      values: ["*"]
EOF
Testing Security Policies
Let’s test our security policies to ensure they’re working correctly:
# Test that authorized requests work
kubectl exec -n onlineboutique deployment/frontend -- \
  curl -s http://productcatalogservice:3550/products | head -5

# Test that unauthorized requests are blocked
kubectl exec -n onlineboutique deployment/productcatalogservice -- \
  curl -s http://checkoutservice:5050/hipstershop.CheckoutService/PlaceOrder --max-time 5 || echo "Access denied as expected"
Monitoring Security Events
Let’s examine security-related logs and metrics:
# Check access logs for security events
kubectl logs -n onlineboutique deployment/frontend -c istio-proxy | grep -i "RBAC" | tail -5

# Check proxy statistics for security metrics
kubectl exec -n onlineboutique deployment/frontend -c istio-proxy -- \
  curl -s localhost:15000/stats | grep -i "rbac\|authz"
Creating a More Permissive Policy for Application Function
To ensure our application functions correctly, let’s create a more permissive policy that allows the necessary service-to-service communication:
# Create a comprehensive allow policy for the application to function
cat <<EOF | kubectl apply -f -
apiVersion: security.istio.io/v1beta1
kind: AuthorizationPolicy
metadata:
  name: onlineboutique-allow
  namespace: onlineboutique
spec:
  action: ALLOW
  rules:
  - from:
    - source:
        principals: ["cluster.local/ns/onlineboutique/sa/default", "cluster.local/ns/onlineboutique/sa/frontend-sa"]
    to:
    - operation:
        methods: ["GET", "POST"]
EOF
This policy allows GET and POST operations between services using the default or frontend service accounts, which should enable the application to function while maintaining security controls.
Validating Application Security
Let’s perform a final validation of our security implementation:
# Test that the application is accessible and functional
kubectl port-forward -n istio-ingress svc/istio-ingress 8080:80 &
sleep 5
curl -H "Host: boutique.local" http://localhost:8080 | grep -i "online boutique"
pkill -f "port-forward"

# Check security policy status
kubectl get authorizationpolicy -n onlineboutique
kubectl describe authorizationpolicy default-deny -n onlineboutique
Your Online Boutique application is now secured with Istio’s security policies, providing mutual TLS encryption and fine-grained access control. In the next objective, we’ll implement observability features to monitor and troubleshoot our service mesh.
Objective 5: Implementing Observability and Monitoring
Observability is one of the most valuable features of Istio service mesh. It provides deep insights into service behavior, performance, and security without requiring any changes to application code. Let’s implement comprehensive observability for our Online Boutique application using Istio’s built-in telemetry capabilities.
Understanding Istio Observability
Istio provides three pillars of observability:
Metrics: Automatically collected metrics about service performance, including request rates, latency, error rates, and saturation.
Logs: Detailed access logs for every request flowing through the mesh.
Traces: Distributed tracing that tracks requests as they flow through multiple services.
Installing Kiali for Service Mesh Visualization
Kiali is the management console for Istio that provides visualization and configuration capabilities:
# Install Kiali using Helm
helm repo add kiali https://kiali.org/helm-charts
helm repo update

# Install Kiali in the istio-system namespace
helm install kiali kiali/kiali-server \
  -n istio-system \
  --set auth.strategy="anonymous" \
  --set external_services.prometheus.url="http://prometheus-server.monitoring.svc.cluster.local:80" \
  --set external_services.grafana.url="http://grafana.monitoring.svc.cluster.local:3000" \
  --wait
This installs Kiali configured to use our existing Prometheus and Grafana installations from Part 2.
Configuring Telemetry Collection
Let’s configure Istio to collect comprehensive telemetry data:
# Create a telemetry configuration for enhanced metrics
cat <<EOF | kubectl apply -f -
apiVersion: telemetry.istio.io/v1alpha1
kind: Telemetry
metadata:
  name: onlineboutique-metrics
  namespace: onlineboutique
spec:
  metrics:
  - providers:
    - name: prometheus
  - overrides:
    - match:
        metric: ALL_METRICS
      tagOverrides:
        request_protocol:
          value: "HTTP"
    - match:
        metric: REQUEST_COUNT
      disabled: false
    - match:
        metric: REQUEST_DURATION
      disabled: false
    - match:
        metric: REQUEST_SIZE
      disabled: false
    - match:
        metric: RESPONSE_SIZE
      disabled: false
EOF
Enabling Distributed Tracing
Let’s configure distributed tracing to track requests across our microservices:
# Install Jaeger for distributed tracing
kubectl apply -f https://raw.githubusercontent.com/istio/istio/release-1.26/samples/addons/jaeger.yaml

# Wait for Jaeger to be ready
kubectl rollout status deployment/jaeger -n istio-system

# Configure telemetry for tracing
cat <<EOF | kubectl apply -f -
apiVersion: telemetry.istio.io/v1alpha1
kind: Telemetry
metadata:
  name: tracing-config
  namespace: onlineboutique
spec:
  tracing:
  - providers:
    - name: jaeger
EOF
Configuring Access Logging
Let’s enable detailed access logging for better debugging capabilities:
# Configure access logging
cat <<EOF | kubectl apply -f -
apiVersion: telemetry.istio.io/v1alpha1
kind: Telemetry
metadata:
  name: access-logging
  namespace: onlineboutique
spec:
  accessLogging:
  - providers:
    - name: otel
EOF
Generating Load for Observability
To see meaningful observability data, let’s generate some load on our application:
# Create a load generation script
cat <<EOF > generate-load.sh
#!/bin/bash
echo "Generating load for observability testing..."
kubectl port-forward -n istio-ingress svc/istio-ingress 8080:80 &
PF_PID=\$!
sleep 5

for i in {1..100}; do
  curl -s -H "Host: boutique.local" http://localhost:8080 > /dev/null
  echo "Request \$i completed"
  sleep 1
done

kill \$PF_PID
echo "Load generation completed"
EOF

chmod +x generate-load.sh
./generate-load.sh
Accessing Kiali Dashboard
Let’s access the Kiali dashboard to visualize our service mesh:
# Port-forward to access Kiali
kubectl port-forward -n istio-system svc/kiali 20001:20001 &
Now you can access Kiali at http://localhost:20001. The dashboard provides:
- Graph view: Visual representation of service communication
- Applications: Application-level metrics and health
- Workloads: Pod-level information and metrics
- Services: Service-level configuration and health
- Istio Config: Istio configuration objects and validation
Accessing Jaeger for Distributed Tracing
Let’s access Jaeger to see distributed traces:
# Port-forward to access Jaeger
kubectl port-forward -n istio-system svc/jaeger-query 16686:16686 &
Access Jaeger at http://localhost:16686. You can:
- Search for traces by service name
- View request flow across multiple services
- Analyze latency and identify bottlenecks
- Understand service dependencies
Integrating with Existing Prometheus
Let’s ensure our existing Prometheus installation is collecting Istio metrics:
# Check if Prometheus is scraping Istio metrics
kubectl exec -n monitoring deployment/prometheus-server -- \
  curl -s localhost:9090/api/v1/targets | grep istio

# Query some Istio metrics
kubectl port-forward -n monitoring svc/prometheus-server 9090:80 &
Access Prometheus at http://localhost:9090 and query metrics like:
istio_requests_total: Total number of requestsistio_request_duration_milliseconds: Request durationistio_request_bytes: Request sizeistio_response_bytes: Response size
Creating Custom Dashboards in Grafana
Let’s create a custom Grafana dashboard for our Online Boutique application:
# Access Grafana
kubectl port-forward -n monitoring svc/grafana 3000:80 &
Access Grafana at http://localhost:3000 (admin/admin) and create dashboards using queries like:
# Request rate by service
sum(rate(istio_requests_total[5m])) by (destination_service_name)

# Error rate by service
sum(rate(istio_requests_total{response_code!~"2.."}[5m])) by (destination_service_name)

# P99 latency by service
histogram_quantile(0.99, sum(rate(istio_request_duration_milliseconds_bucket[5m])) by (destination_service_name, le))
Analyzing Service Mesh Performance
Let’s analyze the performance impact of our service mesh:
# Compare resource usage before and after mesh
kubectl top pods -n onlineboutique --containers | grep -E "(NAME|istio-proxy)"

# Check proxy CPU and memory usage
kubectl exec -n onlineboutique deployment/frontend -c istio-proxy -- \
  curl -s localhost:15000/stats | grep -E "server\.memory|server\.cpu"
Troubleshooting with Observability Tools
Let’s demonstrate how to troubleshoot issues using our observability stack:
# Check service mesh configuration
kubectl exec -n onlineboutique deployment/frontend -c istio-proxy -- \
  curl -s localhost:15000/config_dump | jq '.configs[].dynamic_listeners'

# Analyze proxy logs for errors
kubectl logs -n onlineboutique deployment/frontend -c istio-proxy --tail=50 | grep -i error

# Check metrics for specific services
kubectl exec -n onlineboutique deployment/frontend -c istio-proxy -- \
  curl -s localhost:15000/stats | grep -E "cluster\.outbound.*circuit_breakers"
Setting Up Alerts
Let’s create some basic alerts for our service mesh:
# Create a PrometheusRule for Istio alerts
cat <<EOF | kubectl apply -f -
apiVersion: monitoring.coreos.com/v1
kind: PrometheusRule
metadata:
  name: istio-alerts
  namespace: monitoring
spec:
  groups:
  - name: istio
    rules:
    - alert: IstioHighRequestLatency
      expr: histogram_quantile(0.99, sum(rate(istio_request_duration_milliseconds_bucket[5m])) by (destination_service_name, le)) > 1000
      for: 5m
      labels:
        severity: warning
      annotations:
        summary: "High request latency detected"
        description: "{{ \$labels.destination_service_name }} has high request latency"

    - alert: IstioHighErrorRate
      expr: sum(rate(istio_requests_total{response_code!~"2.."}[5m])) by (destination_service_name) > 0.1
      for: 5m
      labels:
        severity: critical
      annotations:
        summary: "High error rate detected"
        description: "{{ \$labels.destination_service_name }} has high error rate"
EOF
Clean Up Port Forwards
# Stop all port forwards
pkill -f "port-forward"
Your Online Boutique application now has comprehensive observability through Istio’s built-in telemetry capabilities, integrated with your existing monitoring stack from Part 2. You can monitor service performance, troubleshoot issues, and understand service dependencies through the rich observability data provided by the service mesh.
Conclusion and Next Steps
Congratulations! You have successfully implemented a complete Istio service mesh for your Online Boutique application. Over the course of this tutorial, you have:
- Installed Istio using Helm with proper base components and control plane configuration
- Configured sidecar injection to bring your existing microservices into the mesh
- Implemented advanced traffic management with gateways, virtual services, and destination rules
- Established security policies with automatic mTLS and fine-grained authorization controls
- Deployed comprehensive observability with metrics, logging, and distributed tracing
What You’ve Accomplished
Your homelab cluster now demonstrates enterprise-grade capabilities:
- Zero-trust security: All service-to-service communication is encrypted with mTLS
- Intelligent traffic routing: Advanced load balancing, circuit breakers, and fault injection
- Deep observability: Comprehensive metrics, logs, and traces without code changes
- Policy enforcement: Fine-grained authorization and access control
- Operational resilience: Automatic retries, timeouts, and circuit breakers
Key Takeaways
Service mesh provides value without code changes: Istio added sophisticated networking, security, and observability to your existing application without requiring any modifications to the microservices themselves.
Observability is crucial: The visibility into service behavior, performance, and security that Istio provides is essential for operating complex microservices architectures in production.
Security is built-in: Automatic mTLS and policy-based authorization provide a strong security foundation that would be difficult to implement consistently across all services manually.
Traffic management enables advanced deployment patterns: Features like traffic splitting, fault injection, and circuit breakers enable sophisticated deployment strategies like canary releases and chaos engineering.
Production Considerations
While our homelab implementation demonstrates core Istio capabilities, production deployments should consider:
- Resource requirements: Service mesh adds CPU and memory overhead that should be planned for
- Network policies: Integration with Kubernetes network policies for defense-in-depth
- Certificate management: Custom CA certificates and certificate rotation policies
- Multi-cluster scenarios: Extending the mesh across multiple clusters for disaster recovery
- Performance tuning: Optimizing proxy configurations for your specific workload patterns
Recommended Next Steps
To further your service mesh journey, consider exploring:
- Advanced traffic management: Implement canary deployments, blue-green deployments, and A/B testing
- Enhanced security: Configure custom authentication providers and more sophisticated authorization policies
- Multi-cluster mesh: Extend your mesh across multiple Kubernetes clusters
- Custom telemetry: Create custom metrics and integrate with additional monitoring tools
- Chaos engineering: Use Istio’s fault injection to test system resilience
Additional Resources
You can find all the configuration files and scripts used in this tutorial in our GitHub repository.
Thanks for joining us on this tutorial series on learning kubernetes! Your Kubernetes cluster now showcases the sophisticated networking, security, and observability capabilities that make service mesh technology essential for modern microservices architectures. The foundation you’ve built provides an excellent platform for exploring advanced cloud-native patterns and preparing for production-grade deployments.

Aaron Mathis
Systems administrator and software engineer specializing in cloud development, AI/ML, and modern web technologies. Passionate about building scalable solutions and sharing knowledge with the developer community.
Related Articles
Discover more insights on similar topics