Gosight
GoSight is a high-performance, cross-platform observability platform for infrastructure at any scale. It collects detailed metrics and logs from hosts and containers, streams data in real time, evaluates complex alert rules and exposes it all through powerful APIs, dashboards, and a dynamic metric explorer.
Project Information

ð§ Development Status
GoSight is under active development and not yet production-ready. However, many core features are implemented and functional:
- Agent/server metric + log + trace streaming via OpenTelemetry + gRPC
- SYSLOG ingestion over TCP/UDP
- Web dashboard with tabs, charts, and endpoint views
- TLS/mTLS authentication, JWT session handling
- Modular collectors: CPU, memory, disk, net, journald, eventlog, podman, docker
- Log and metric APIs for filtering and export
- Metric Explorer with multi-series charting
- Alerting system with flexible rule logic and route actions
- Permission-based access control
See Project Status for detailed roadmap.
GoSight is a high-performance, modular, and vendor-agnostic observability platform written in Go. It includes a lightweight agent for collecting metrics and logs from Windows, macOS, and Linux systems (including Docker and Podman containers), and a server that aggregates, stores, and exposes those metrics securely over gRPC, with TLS/mTLS.
GoSight supports a full observability pipeline including:
- System and container metrics (CPU, memory, disk, network, uptime, etc.)
- Structured and unstructured log collection (journald, flat files, syslog)
- Planned: Cloud-native metrics via extensible integrations (AWS CloudWatch, GCP Monitoring, Azure Monitor)
- WebSocket-based live streaming of telemetry
- Advanced alerting, filtering, and incident correlation
- Remote-safe command dispatch and automation hooks (Ansible runbooks)
Core Features
- Robust metric and log collection on Windows, Linux, and macOS
- Container observability via Docker and Podman
- Secure agent-server communication using TLS/mTLS
- Metric storage in VictoriaMetrics with in-memory indexing
- Rich API for querying logs and metrics
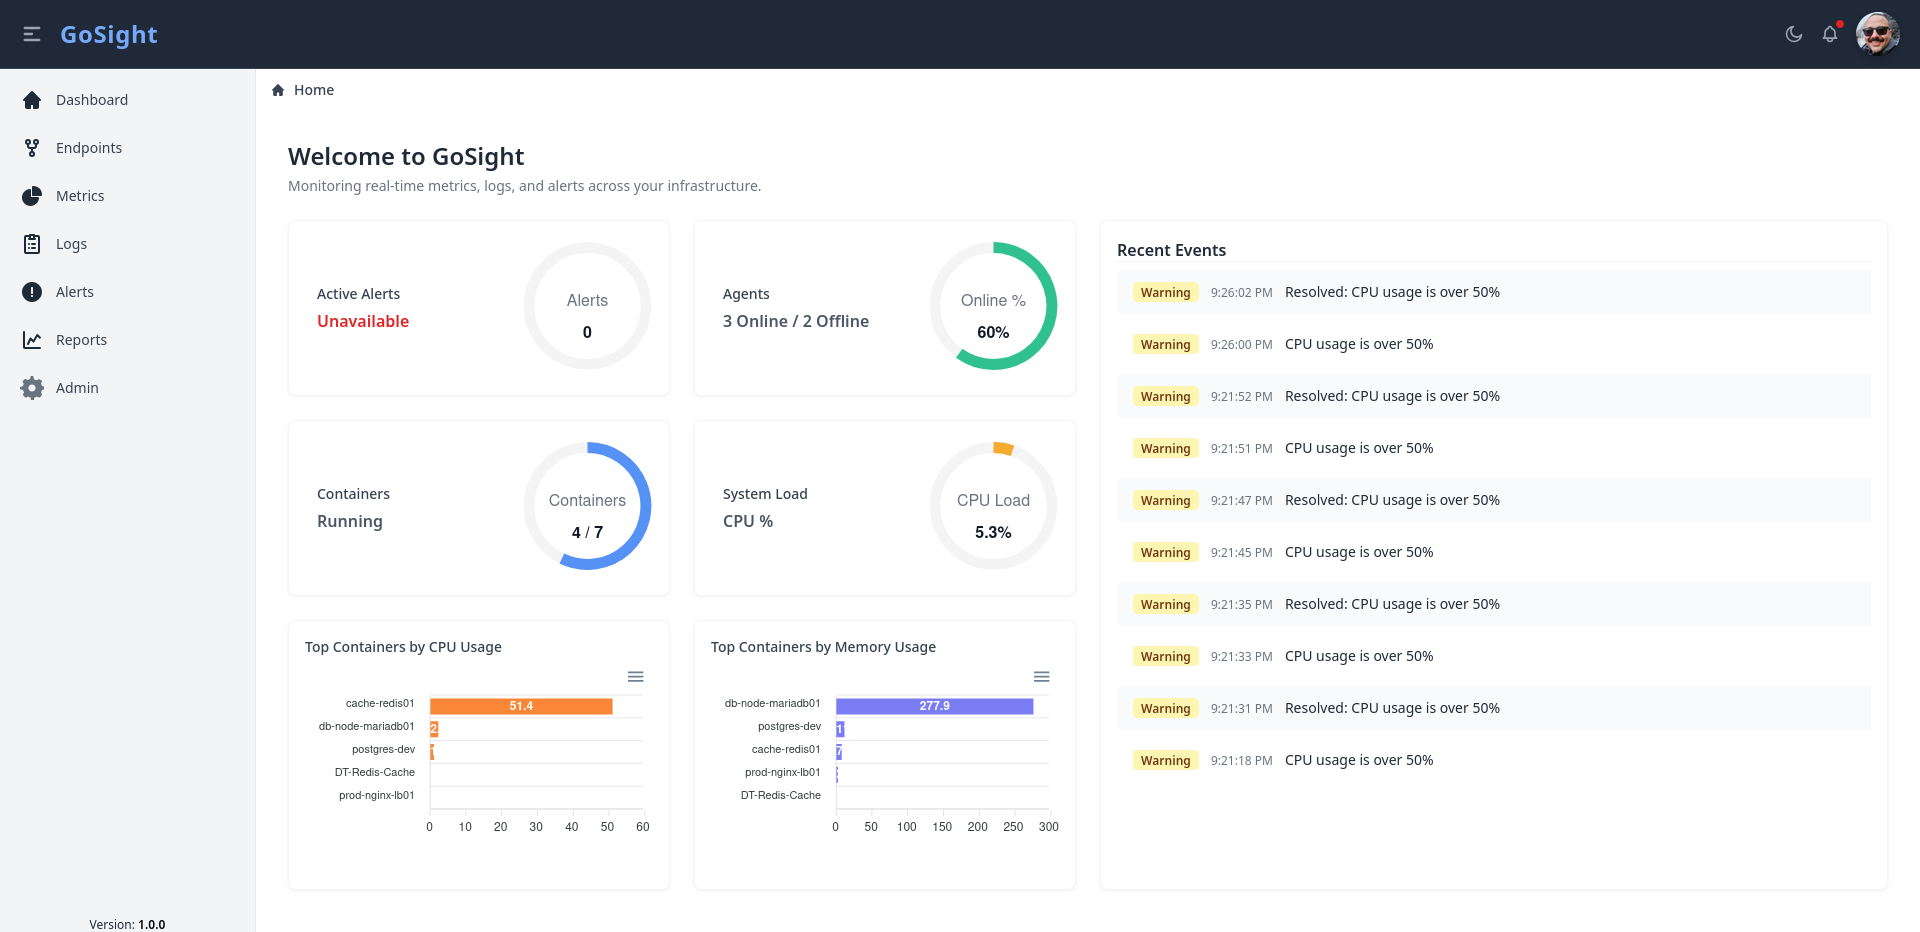
- Dynamic dashboard with tabs, charts, and filters (responsive UI)
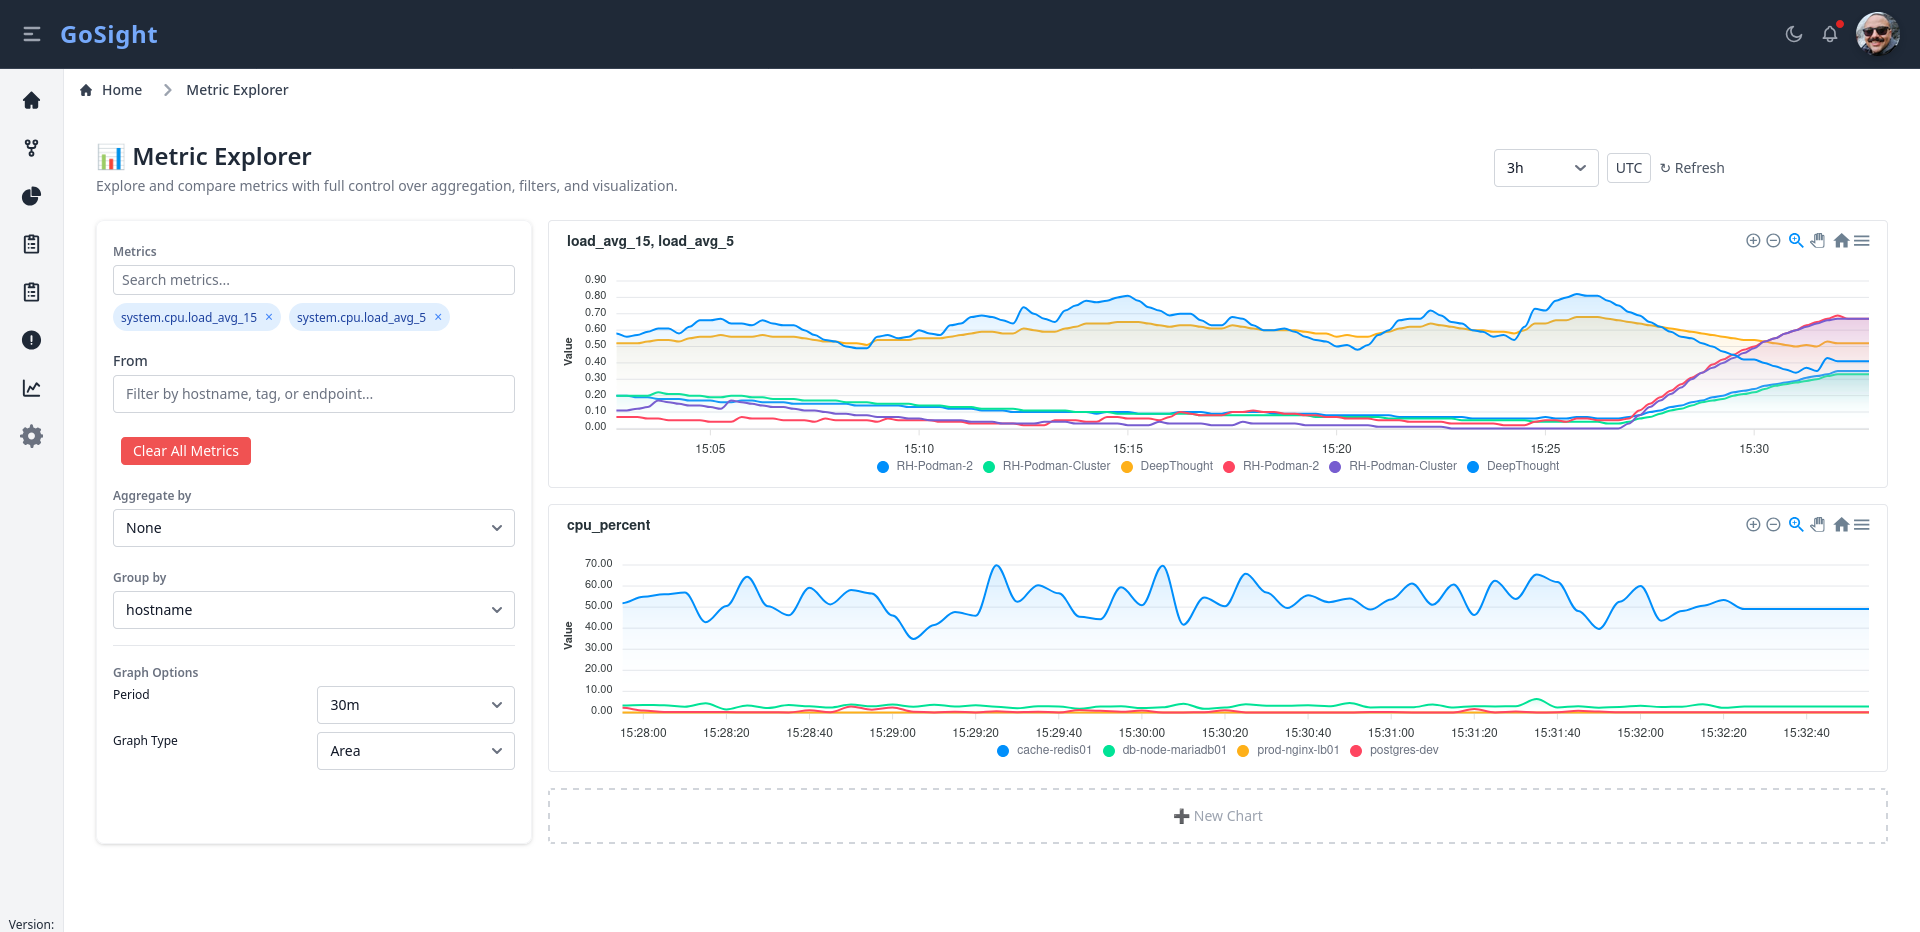
- Metric Explorer for building complex multi-series graphs with filters, grouping, aggregation, and timespan
- Alert Engine supporting threshold-based and multi-condition rules with cooldowns and repeat intervals
- Action Routes to send alerts via Webhook, Email, or execute a local Script (configurable routing)
- Incident View with logs, metrics, and timeline context
- Support for approved command execution (e.g. podman/docker or scripts) with safety checks
- Support for executing Ansible Runbooks on endpoints
- Full IAM support: roles, permissions, SSO, RBAC, session security
ð Table of Contents
Why GoSight?
Observability tools are often bloated, vendor-locked, or inflexible. GoSight aims to be:
- Vendor-agnostic â works with any backend (VictoriaMetrics, InfluxDB, Timescale)
- Modular â pluggable collectors and storage interfaces
- Efficient â fast Go-based agents with minimal overhead
- Secure â TLS/mTLS, signed JWTs, and RBAC
- Unified â logs, metrics, dashboards, and alerts from a single stack
Components
Agent
- Exposes OpenTelemetry Endpoint (GRPC/HTTP) to collect metrics, logs, traces
- Works with baremetal/virtual hosts as well as K8s
- Collects system metrics, container stats, and logs
- Sends telemetry via gRPC (TLS/mTLS)
- Supports runtime-safe command execution (whitelisted)
- Configurable via YAML, env, or flags
Server
- Receives telemetry from agents
- Stores metrics (VictoriaMetrics) and logs (compressed JSON or pluggable backend)
- Hosts dashboards, WebSocket broadcasters, and API endpoints
- Evaluates alert rules and dispatches actions via routes (email, webhook, script)
- Exposes query endpoints for metric explorer and log search
Shared
gosight-sharedâ Shared proto definitions, model structs, and utilities
Contributing
GoSight is early-stage and actively evolving. Contributions are welcome in all areas:
- Svelte5, Sveltekit, Shadcn, Charting (ApexCharts)
- Backend: Go, gRPC, Alert evaluation, API design
- Infra: Agent packaging, deployment, CI
- UX: Log explorer, incident view, global search, whitelabel
See CONTRIBUTING.md for setup and task ideas.
Quick Start (Dev)
Clone the repo and run:
make devThis will:
- Start PostgreSQL and VictoriaMetrics containers
- Build and launch the GoSight server and agent
- Generate TLS/mTLS certificates in the right location
Access the dashboard at: https://localhost:8443
TLS / mTLS Setup
Certs live under /certs. To regenerate:
# Linux/macOS
./install/generate_certs_with_san.sh

# Windows PowerShell
./install/generate_certs_with_san.ps1
Update config.yaml to match cert paths.
Build
go build -o gosight-agent ./agent/cmd
go build -o gosight-server ./server/cmd
Dashboard
Metric Explorer
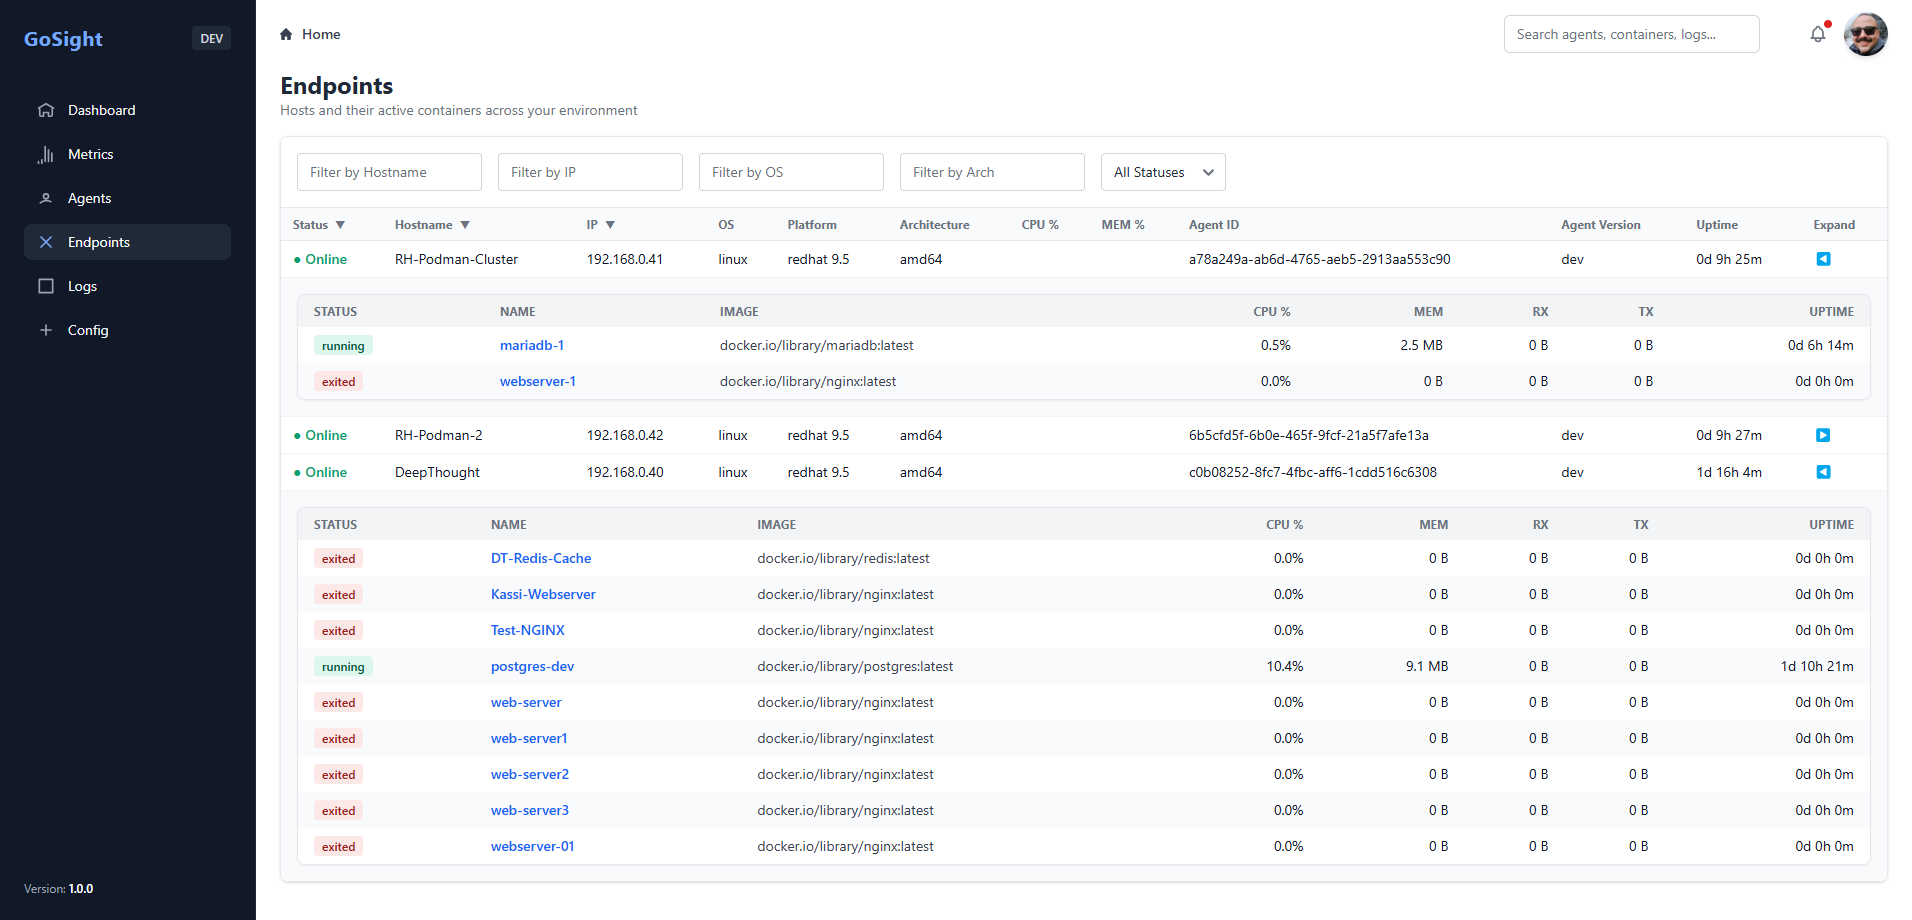
Home Dashboard
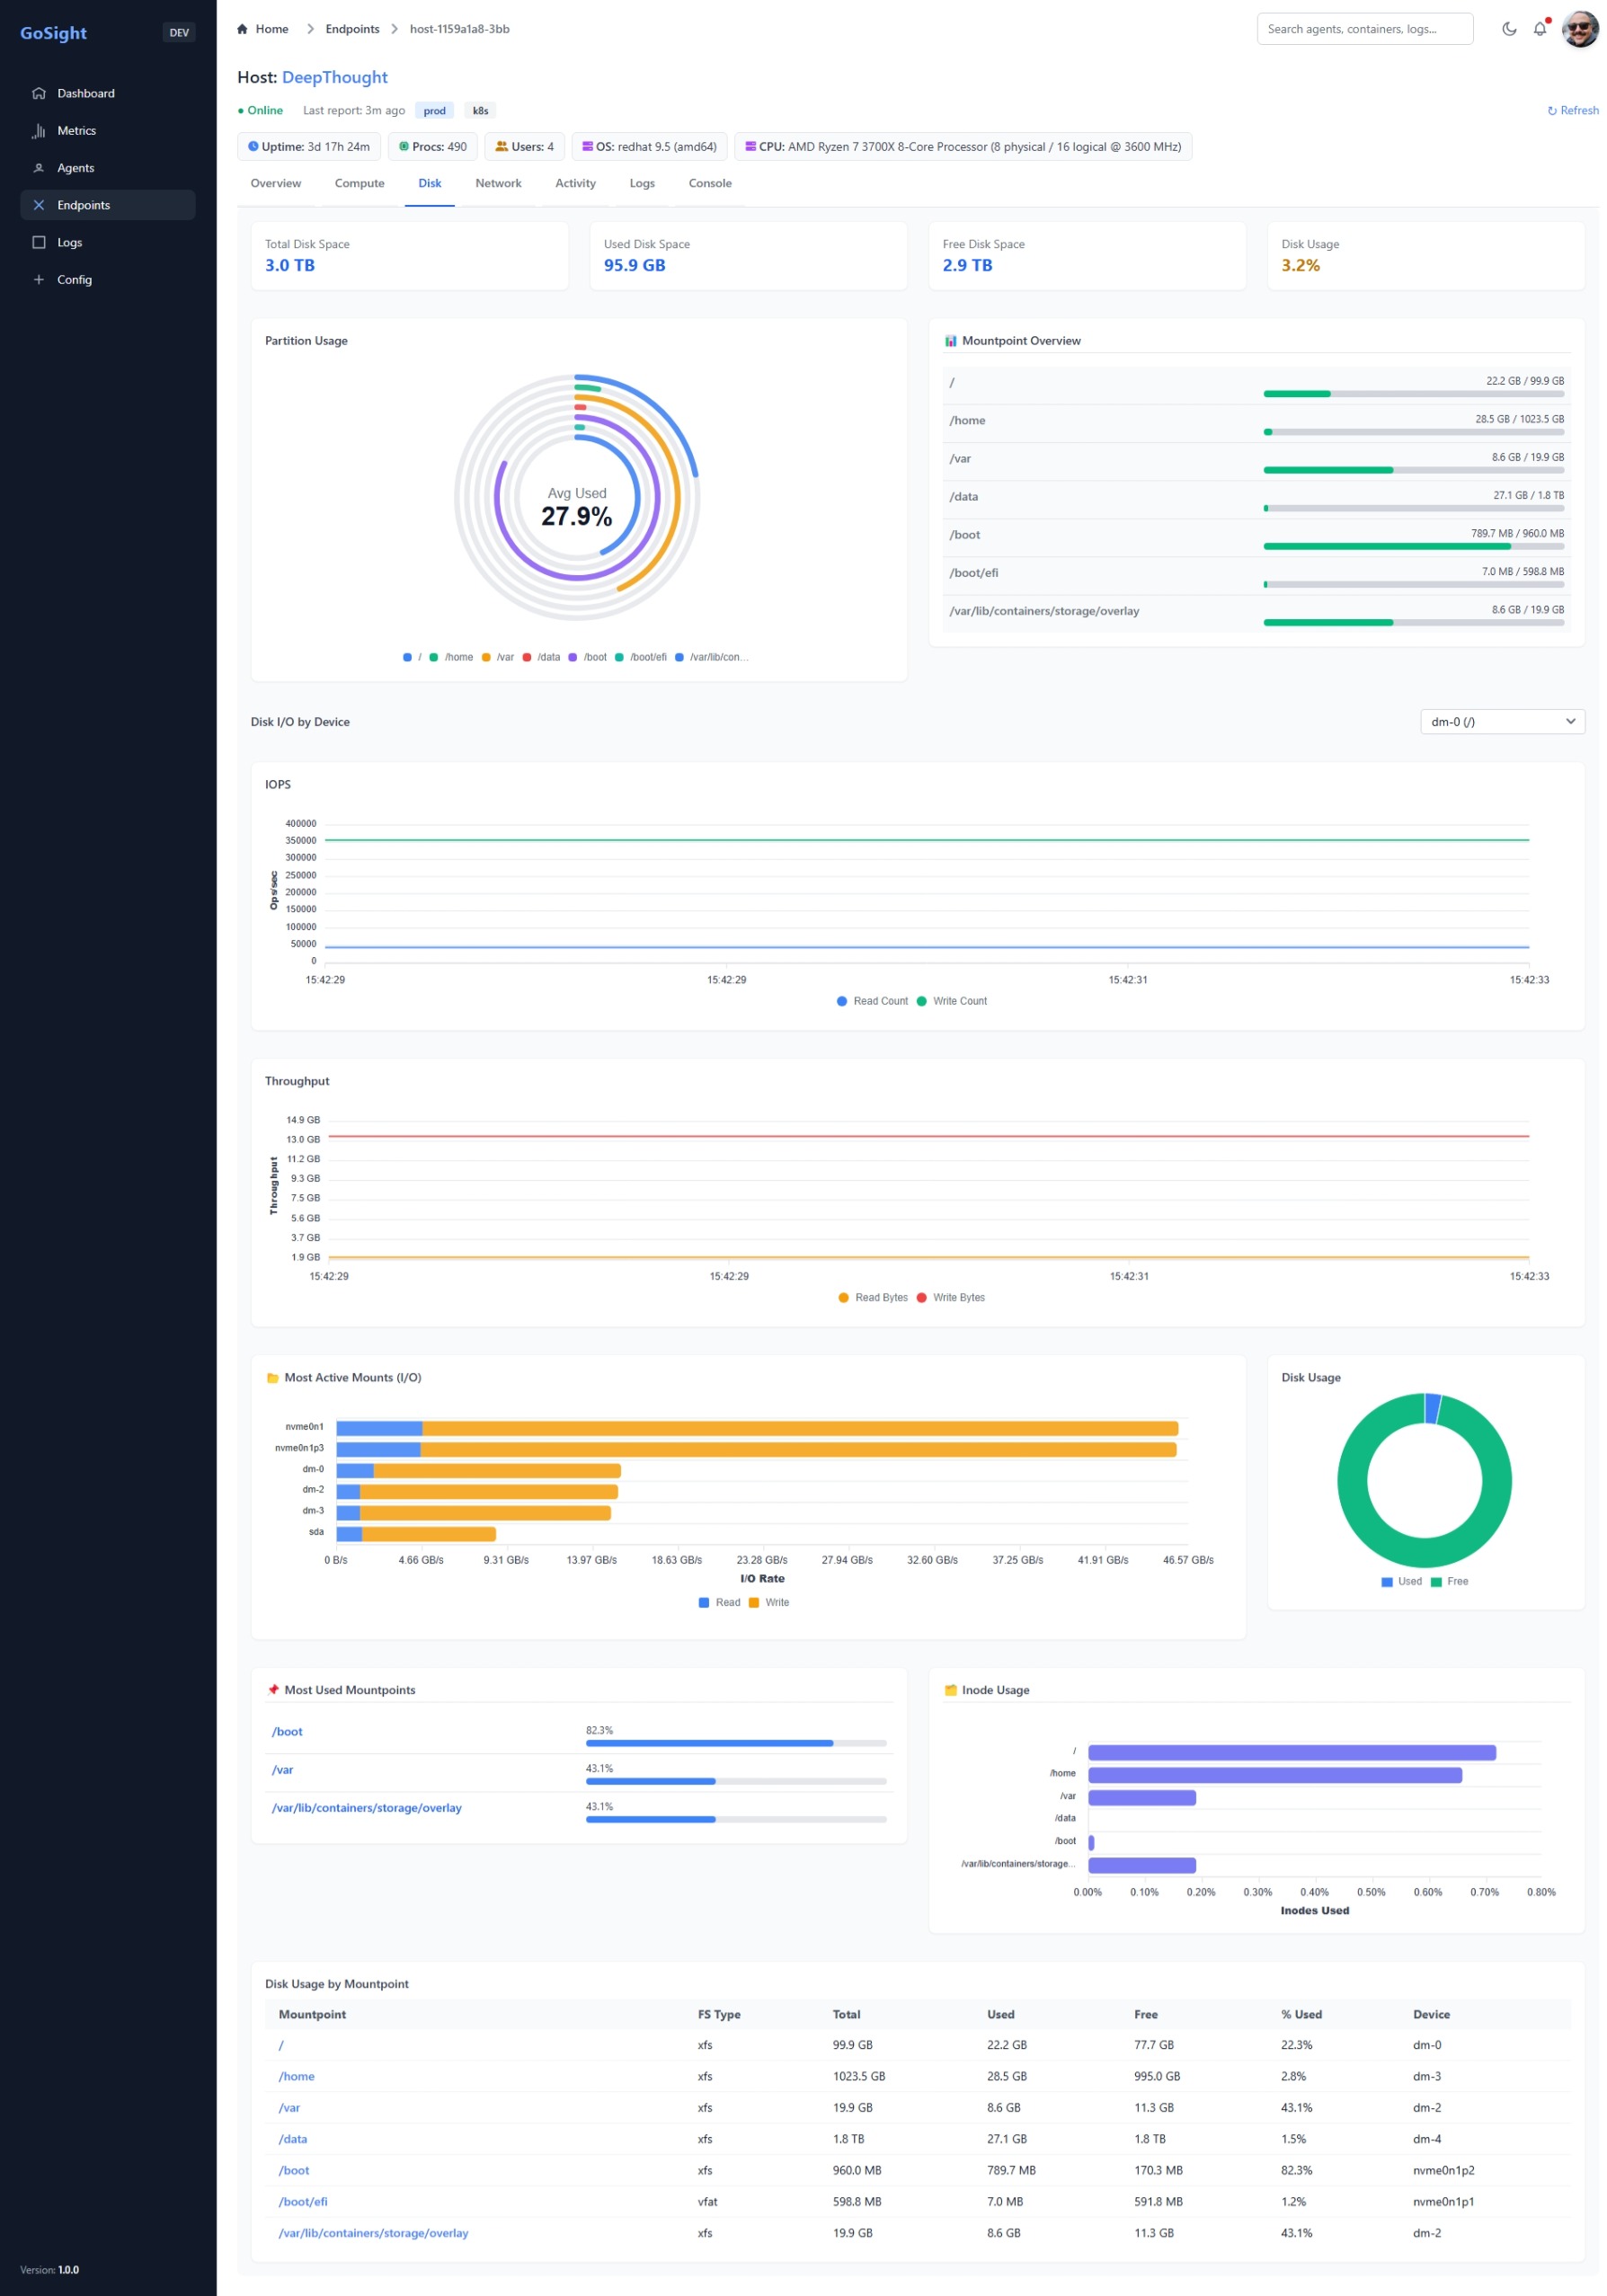
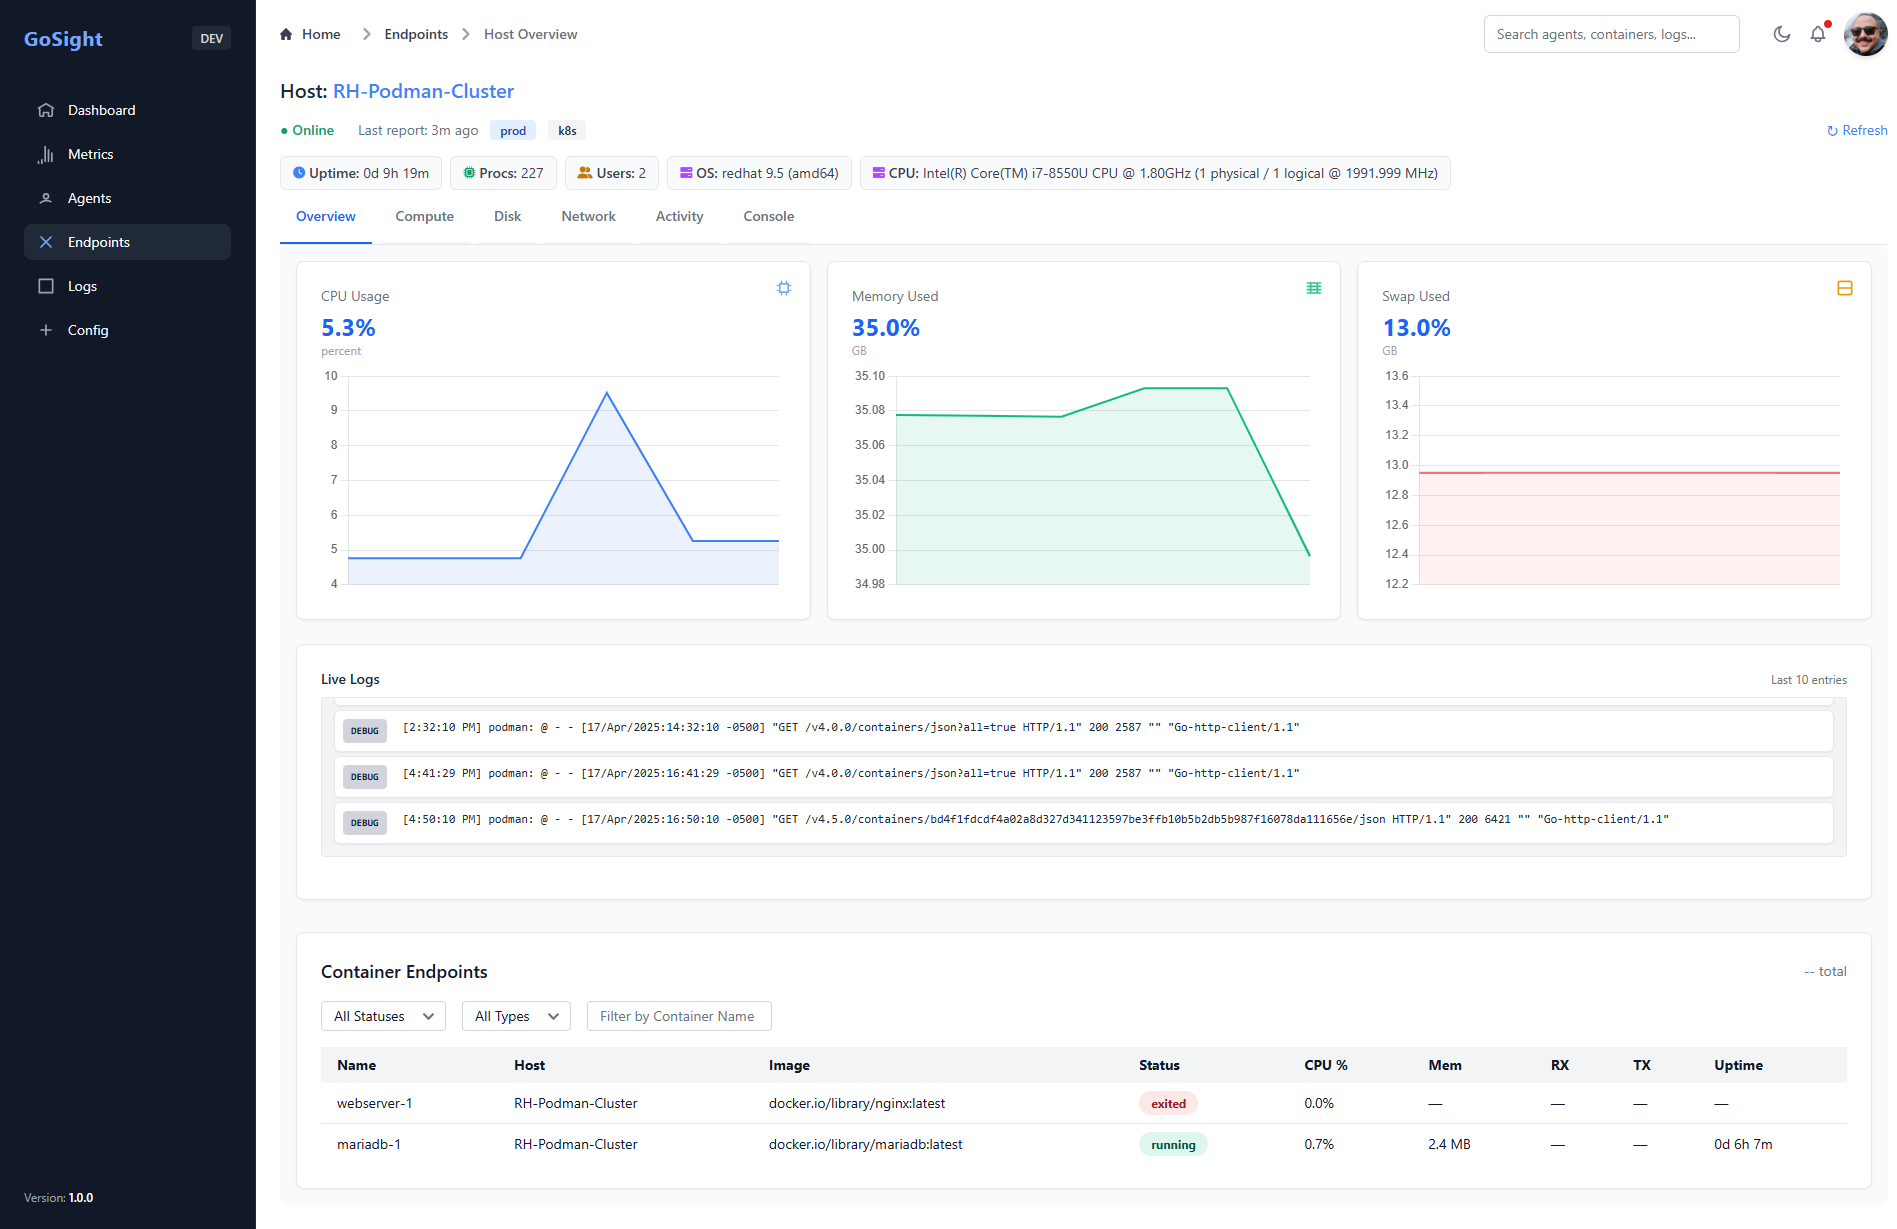
Endpoint Details (Disk Tab)
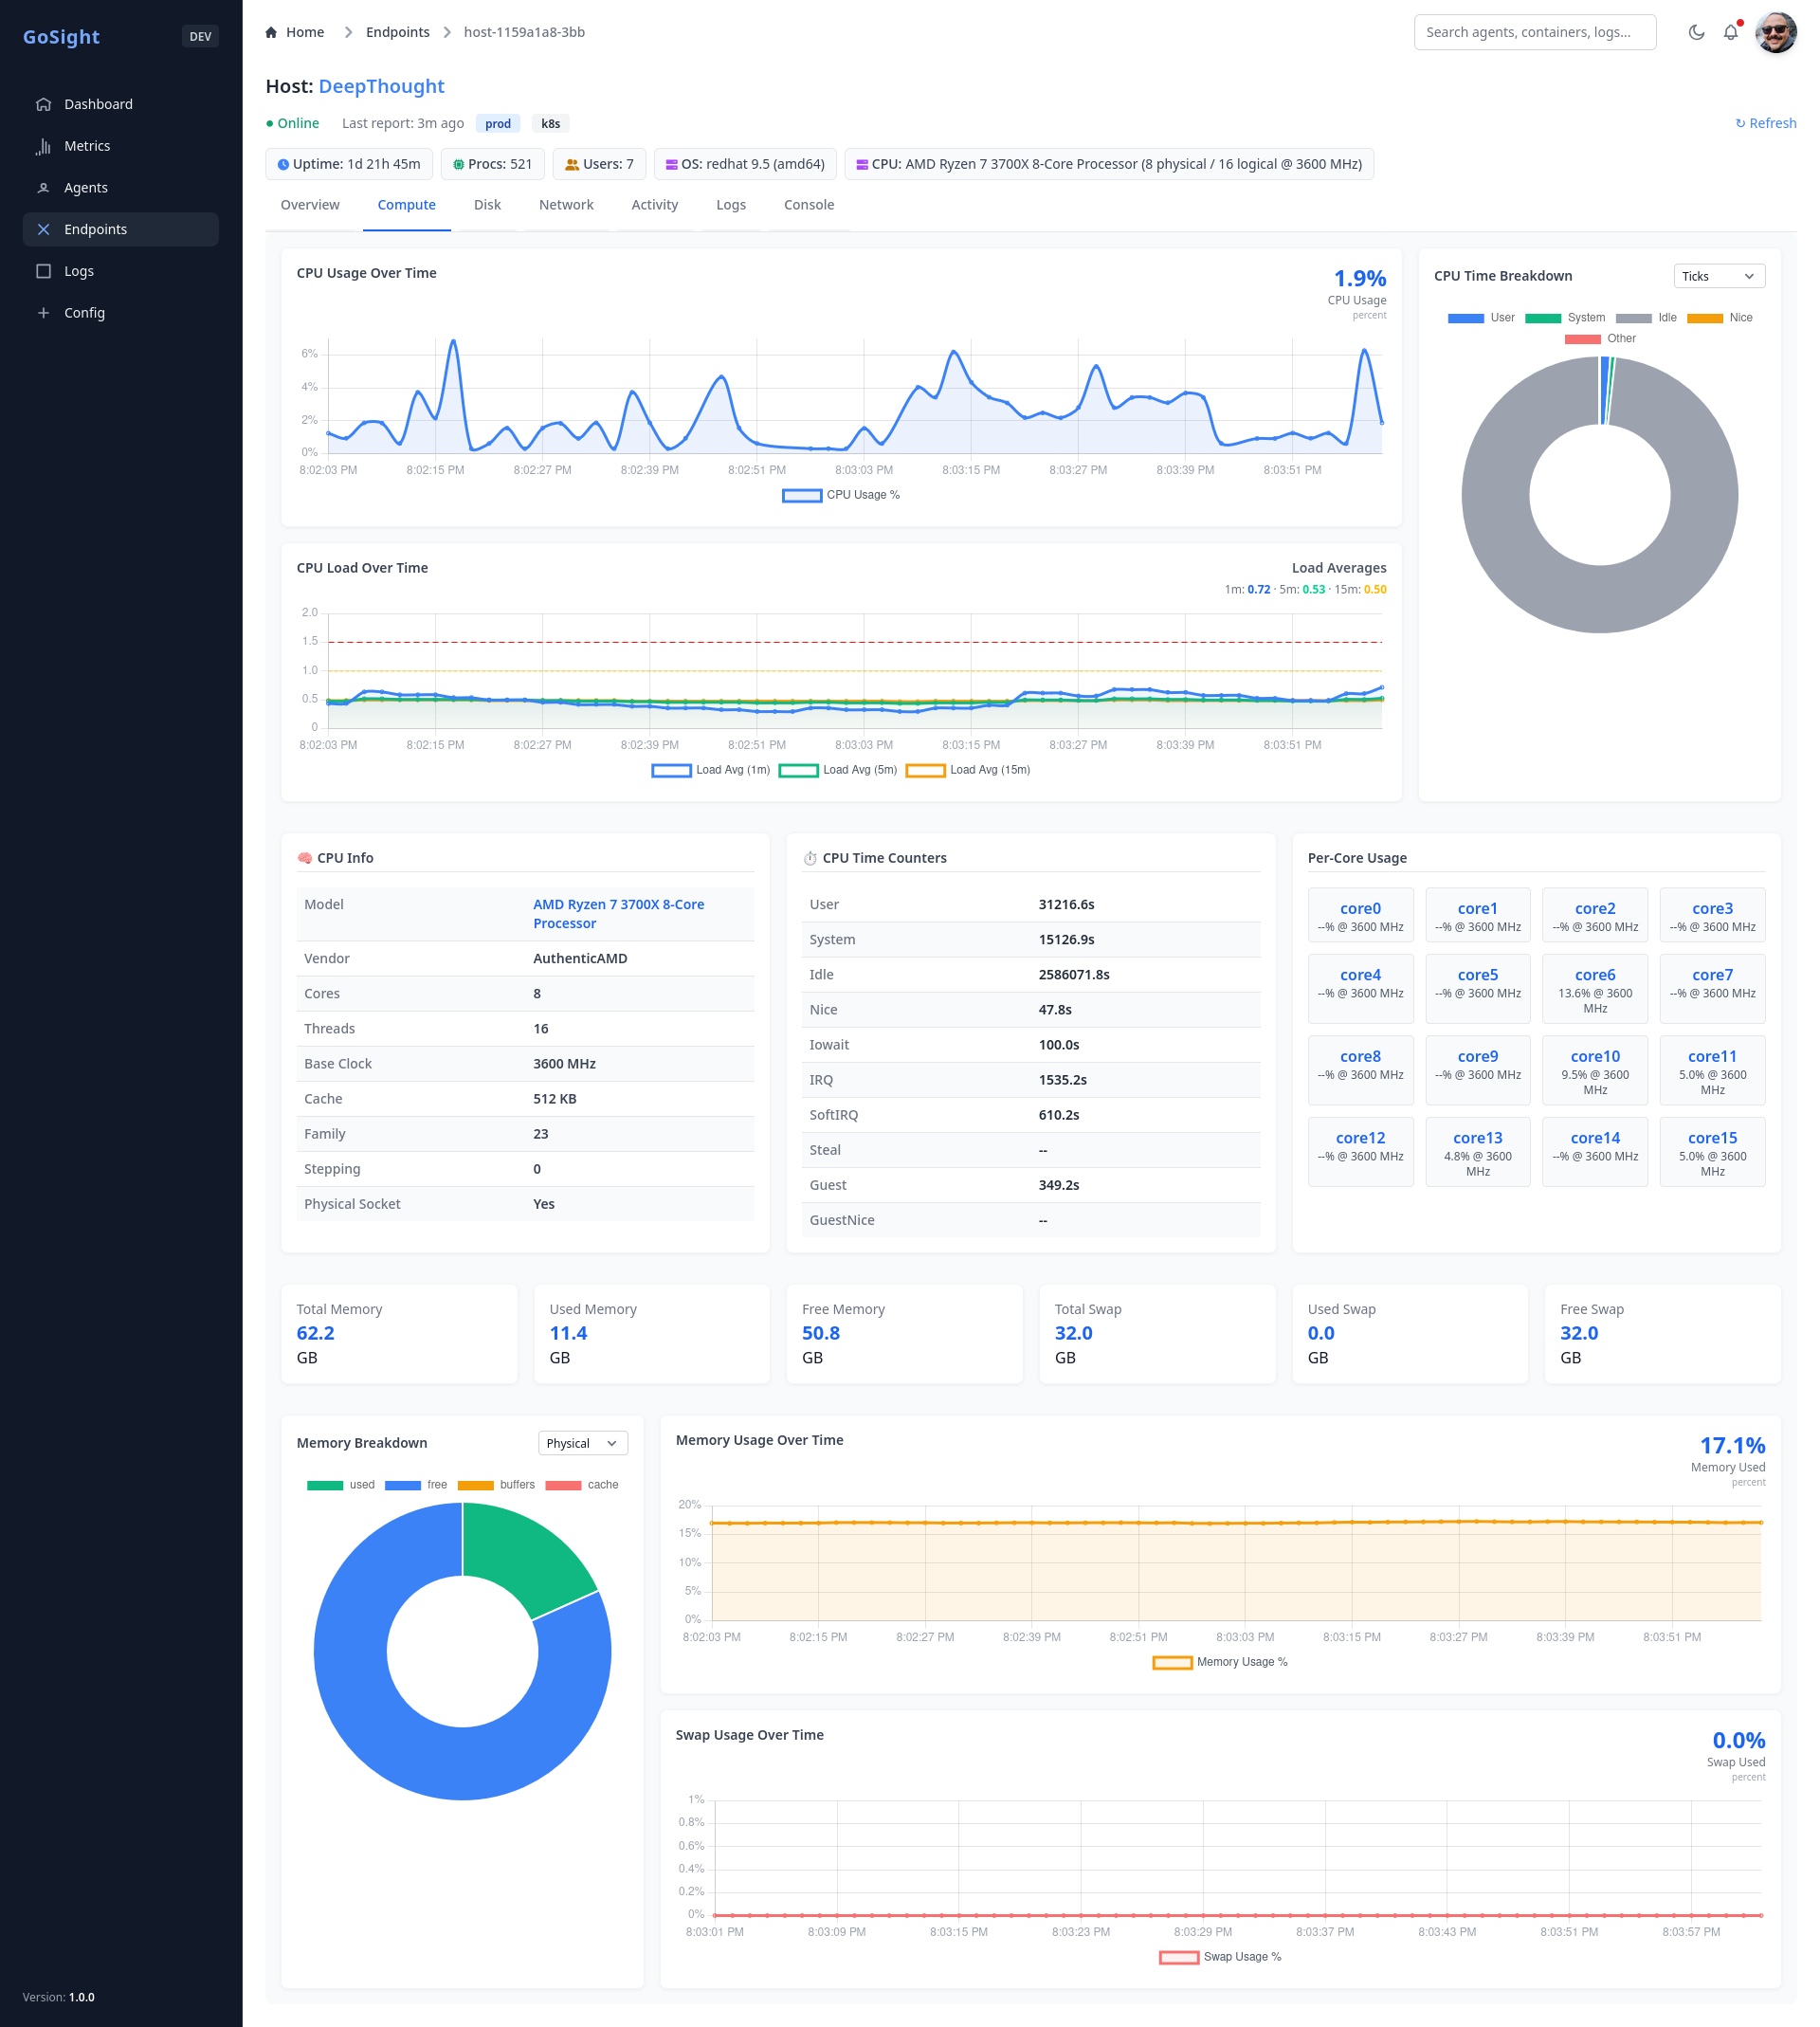
Compute Tab
Endpoint Summary Table
Overview Tab
License
GoSight is licensed under the GPL-3.0-or-later.
Images are automatically mirrored
Images from the GitHub repository are downloaded and hosted locally to ensure they load properly.