Building Scalable Microservices with Kubernetes and Docker
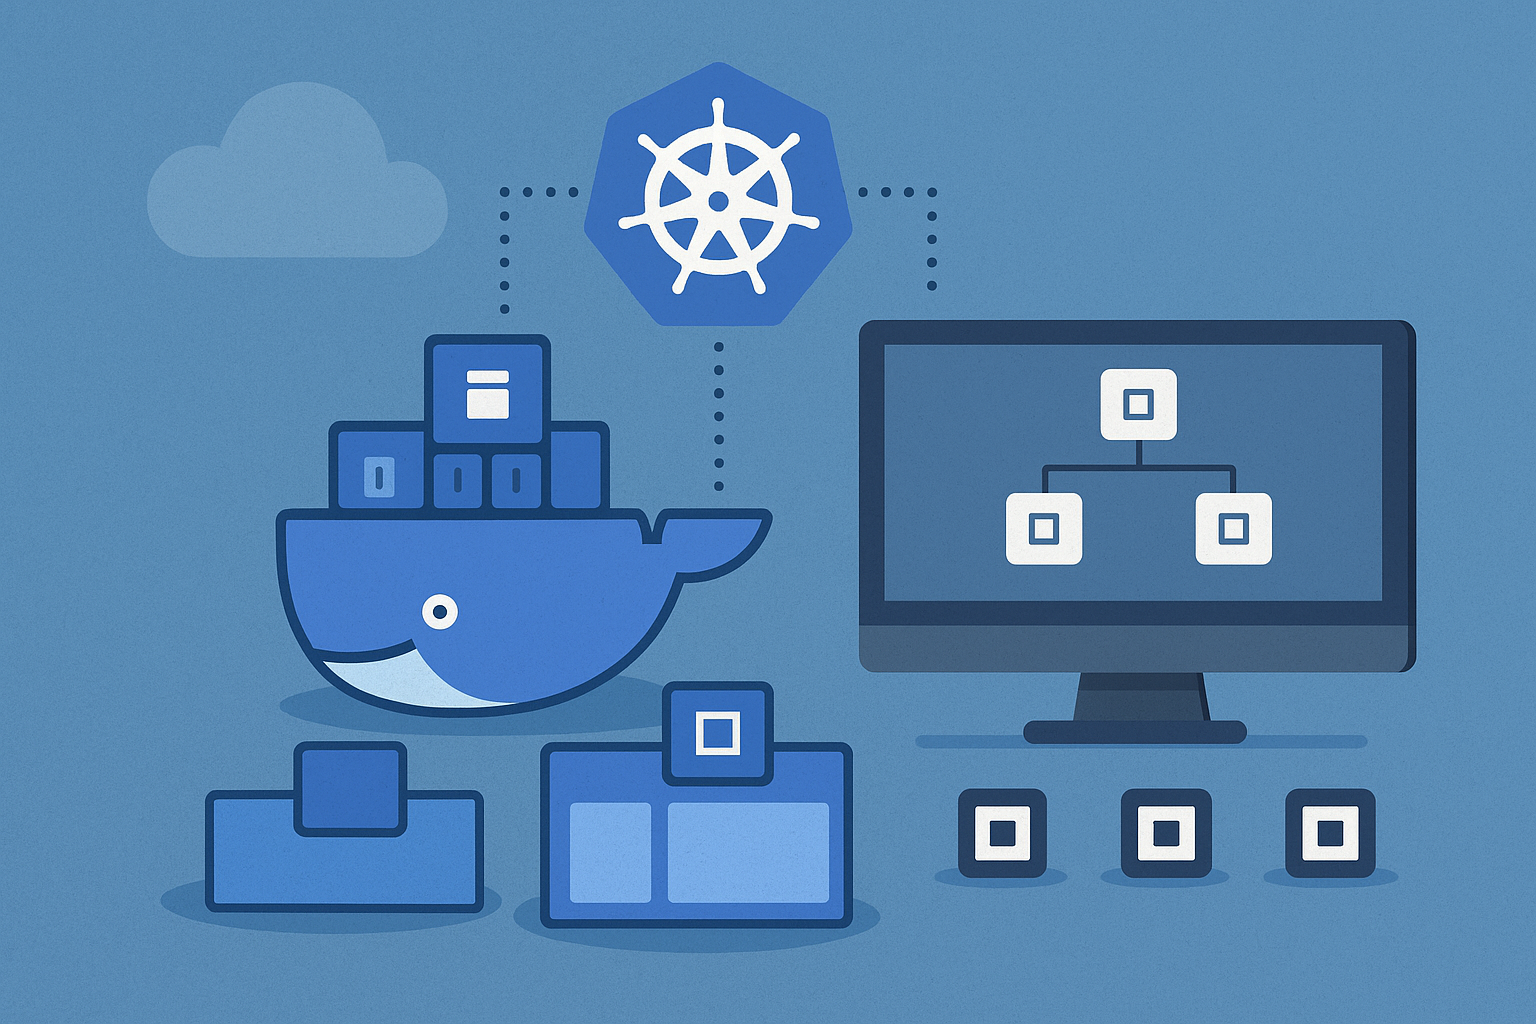
A comprehensive guide to designing, implementing, and deploying microservices architecture using Kubernetes orchestration and Docker containerization.

Building Scalable Microservices with Kubernetes and Docker
Microservices architecture has become the de facto standard for building scalable, maintainable applications in the cloud era. In this comprehensive guide, we’ll explore how to design, implement, and deploy microservices using Kubernetes and Docker.
Why Microservices? A Lesson Learned the Hard Way
I’ll never forget the day our monolithic e-commerce platform crashed during Black Friday. What started as a simple payment processing bug brought down our entire application - product catalog, user authentication, inventory management, everything. That’s when I truly understood why companies like Netflix and Amazon had moved to microservices architecture.
Traditional monolithic applications feel straightforward when you’re building your first version. Everything lives in one codebase, deployment is simple, and debugging seems easier. But as your application grows and your team expands, that simplicity becomes a liability. I’ve seen teams paralyzed by the fear of deploying because one small change could break unrelated features.
Microservices architecture addresses these challenges by breaking down applications into smaller, independent services. Think of it like moving from a studio apartment to a house with separate rooms - each space serves a specific purpose, and problems in one area don’t necessarily affect the others.
Getting Started with Docker
Docker provides the foundation for microservices by packaging applications into lightweight, portable containers.
Your First Microservice: Start Simple
Let’s build something real together. We’ll create a user management service - nothing fancy, just enough to demonstrate the concepts. I always recommend starting with a service that has clear boundaries and minimal dependencies.
Our user service will handle basic CRUD operations for user data. Here’s why this makes a perfect first microservice: it has a clear single responsibility (managing users), it’s something every application needs, and it’s relatively self-contained.
// app.js - Complete user service implementation
const express = require('express');
const cors = require('cors');
const helmet = require('helmet');
const app = express();
const port = process.env.PORT || 3000;

// Middleware
app.use(helmet());
app.use(cors());
app.use(express.json());

// In-memory database (use a real database in production)
let users = [
  { id: 1, name: 'John Doe', email: '[email protected]', createdAt: new Date().toISOString() },
  { id: 2, name: 'Jane Smith', email: '[email protected]', createdAt: new Date().toISOString() }
];

let nextId = 3;

// Health check endpoint - essential for Kubernetes
app.get('/health', (req, res) => {
  res.json({
    status: 'healthy',
    timestamp: new Date().toISOString(),
    service: 'user-service',
    version: process.env.SERVICE_VERSION || '1.0.0'
  });
});

// Get all users
app.get('/api/users', (req, res) => {
  const page = parseInt(req.query.page) || 1;
  const limit = parseInt(req.query.limit) || 10;
  const startIndex = (page - 1) * limit;
  const endIndex = page * limit;

  const paginatedUsers = users.slice(startIndex, endIndex);

  res.json({
    users: paginatedUsers,
    pagination: {
      page,
      limit,
      total: users.length,
      pages: Math.ceil(users.length / limit)
    }
  });
});

// Get user by ID
app.get('/api/users/:id', (req, res) => {
  const user = users.find(u => u.id === parseInt(req.params.id));
  if (!user) {
    return res.status(404).json({ error: 'User not found' });
  }
  res.json(user);
});

// Create new user
app.post('/api/users', (req, res) => {
  const { name, email } = req.body;

  if (!name || !email) {
    return res.status(400).json({ error: 'Name and email are required' });
  }

  const newUser = {
    id: nextId++,
    name,
    email,
    createdAt: new Date().toISOString()
  };

  users.push(newUser);
  res.status(201).json(newUser);
});

// Update user
app.put('/api/users/:id', (req, res) => {
  const userIndex = users.findIndex(u => u.id === parseInt(req.params.id));
  if (userIndex === -1) {
    return res.status(404).json({ error: 'User not found' });
  }

  users[userIndex] = { ...users[userIndex], ...req.body };
  res.json(users[userIndex]);
});

// Delete user
app.delete('/api/users/:id', (req, res) => {
  const userIndex = users.findIndex(u => u.id === parseInt(req.params.id));
  if (userIndex === -1) {
    return res.status(404).json({ error: 'User not found' });
  }

  users.splice(userIndex, 1);
  res.status(204).send();
});

// Error handling middleware
app.use((err, req, res, next) => {
  console.error(err.stack);
  res.status(500).json({ error: 'Something went wrong!' });
});

// 404 handler
app.use((req, res) => {
  res.status(404).json({ error: 'Route not found' });
});

app.listen(port, () => {
  console.log(`User service listening on port ${port}`);
  console.log(`Health check available at http://localhost:${port}/health`);
});
Notice how we’ve expanded the service to include proper error handling, pagination, and all CRUD operations. The health check endpoint returns detailed information that Kubernetes can use for monitoring. In production, you’d replace the in-memory storage with a proper database and add authentication.
// package.json
{
  "name": "user-service",
  "version": "1.0.0",
  "description": "User management microservice",
  "main": "app.js",
  "scripts": {
    "start": "node app.js",
    "dev": "nodemon app.js",
    "test": "jest"
  },
  "dependencies": {
    "express": "^4.18.2",
    "cors": "^2.8.5",
    "helmet": "^7.0.0"
  },
  "devDependencies": {
    "nodemon": "^3.0.1",
    "jest": "^29.5.0",
    "supertest": "^6.3.3"
  }
}
Multi-Stage Dockerfile for Production
# Multi-stage build for smaller production images
FROM node:18-alpine AS builder

WORKDIR /app
COPY package*.json ./
RUN npm ci --only=production && npm cache clean --force

# Production stage
FROM node:18-alpine AS production

# Create app directory
WORKDIR /app

# Create non-root user
RUN addgroup -g 1001 -S nodejs
RUN adduser -S nodeuser -u 1001

# Copy built dependencies
COPY --from=builder /app/node_modules ./node_modules
COPY --chown=nodeuser:nodejs . .

# Set environment variables
ENV NODE_ENV=production
ENV SERVICE_VERSION=1.0.0

# Expose port
EXPOSE 3000

# Switch to non-root user
USER nodeuser

# Health check
HEALTHCHECK --interval=30s --timeout=3s --start-period=5s --retries=3 \
  CMD curl -f http://localhost:3000/health || exit 1

CMD ["node", "app.js"]
Building and Testing Your Container
# Build the Docker image
docker build -t user-service:1.0.0 .

# Run locally for testing
docker run -p 3000:3000 --name user-service-test user-service:1.0.0

# Test the service
curl http://localhost:3000/health
curl http://localhost:3000/api/users

# Clean up
docker stop user-service-test
docker rm user-service-test
Kubernetes Orchestration
Now that we have a containerized service, let’s deploy it to Kubernetes. The transition from Docker to Kubernetes might seem daunting, but think of Kubernetes as your container orchestrator - it ensures your services run reliably, scale automatically, and recover from failures.
Complete Deployment Configuration
# user-service-deployment.yaml
apiVersion: apps/v1
kind: Deployment
metadata:
  name: user-service
  labels:
    app: user-service
    version: "1.0.0"
spec:
  replicas: 3
  selector:
    matchLabels:
      app: user-service
  template:
    metadata:
      labels:
        app: user-service
        version: "1.0.0"
    spec:
      containers:
      - name: user-service
        image: your-registry/user-service:1.0.0
        ports:
        - containerPort: 3000
          name: http
        env:
        - name: NODE_ENV
          value: "production"
        - name: SERVICE_VERSION
          value: "1.0.0"
        - name: PORT
          value: "3000"
        resources:
          requests:
            memory: "128Mi"
            cpu: "100m"
          limits:
            memory: "256Mi"
            cpu: "200m"
        livenessProbe:
          httpGet:
            path: /health
            port: http
          initialDelaySeconds: 30
          periodSeconds: 10
          timeoutSeconds: 5
          failureThreshold: 3
        readinessProbe:
          httpGet:
            path: /health
            port: http
          initialDelaySeconds: 5
          periodSeconds: 5
          timeoutSeconds: 3
          failureThreshold: 3
        # Graceful shutdown
        lifecycle:
          preStop:
            exec:
              command: ["/bin/sh", "-c", "sleep 15"]
      # Improve scheduling
      affinity:
        podAntiAffinity:
          preferredDuringSchedulingIgnoredDuringExecution:
          - weight: 100
            podAffinityTerm:
              labelSelector:
                matchExpressions:
                - key: app
                  operator: In
                  values:
                  - user-service
              topologyKey: kubernetes.io/hostname
---
apiVersion: v1
kind: Service
metadata:
  name: user-service
  labels:
    app: user-service
spec:
  selector:
    app: user-service
  ports:
    - name: http
      protocol: TCP
      port: 80
      targetPort: http
  type: ClusterIP
---
# Optional: Ingress for external access
apiVersion: networking.k8s.io/v1
kind: Ingress
metadata:
  name: user-service-ingress
  annotations:
    nginx.ingress.kubernetes.io/rewrite-target: /
spec:
  rules:
  - host: api.yourcompany.com
    http:
      paths:
      - path: /users
        pathType: Prefix
        backend:
          service:
            name: user-service
            port:
              number: 80
Deploy to Kubernetes
# Apply the configuration
kubectl apply -f user-service-deployment.yaml

# Check deployment status
kubectl get deployments
kubectl get pods -l app=user-service
kubectl get services

# View logs
kubectl logs -l app=user-service -f

# Test the service internally
kubectl port-forward service/user-service 8080:80
curl http://localhost:8080/api/users
Best Practices
1. Service Design Principles That Actually Work
After building dozens of microservices over the past few years, I’ve learned that successful service design comes down to three core principles that work together like a well-orchestrated symphony.
The first principle is single responsibility - and I mean truly single. When I review microservices architectures, I often see services trying to do too much. Your user service shouldn’t also handle notifications, and your payment service shouldn’t manage inventory. Each service should have one clear reason to exist and one reason to change. When you find yourself adding “and also handles…” to your service description, it’s time to split it up.
Loose coupling goes hand in hand with single responsibility. I’ve seen teams create microservices that were so tightly coupled they might as well have been a monolith. Services should communicate through well-defined APIs and avoid sharing databases or internal implementation details. Think of it like building with LEGO blocks - each piece should connect cleanly without requiring modifications to other pieces.
High cohesion ensures that related functionality stays together. While you want loose coupling between services, you want tight cohesion within each service. All the code related to user authentication should live in your auth service, not scattered across multiple services. This makes your codebase more intuitive and easier to maintain.
2. Communication Patterns: Choosing the Right Tool
One of the biggest decisions you’ll face is how your services talk to each other. I learned this lesson when building a food delivery platform where we initially made everything synchronous. When a user placed an order, our order service would immediately call the inventory service, which called the payment service, which called the notification service. It worked fine in testing, but under real load, one slow service brought down the entire chain.
Synchronous Communication works well for operations that need immediate responses. When a user logs in, you need to verify their credentials right away. Here’s how to implement resilient HTTP communication between services:
// auth-client.js - Resilient service-to-service communication
const axios = require('axios');
const CircuitBreaker = require('opossum');

class AuthClient {
  constructor(baseURL = process.env.AUTH_SERVICE_URL) {
    this.client = axios.create({
      baseURL,
      timeout: 5000,
      headers: {
        'Content-Type': 'application/json',
        'X-Service-Name': 'user-service'
      }
    });

    // Circuit breaker configuration
    const breakerOptions = {
      timeout: 3000,
      errorThresholdPercentage: 50,
      resetTimeout: 30000
    };

    this.verifyTokenBreaker = new CircuitBreaker(this._verifyToken.bind(this), breakerOptions);

    // Handle circuit breaker events
    this.verifyTokenBreaker.on('open', () =>
      console.warn('Auth service circuit breaker opened'));
    this.verifyTokenBreaker.on('halfOpen', () =>
      console.info('Auth service circuit breaker half-open'));
  }

  async _verifyToken(token) {
    const response = await this.client.post('/verify', { token });
    return response.data;
  }

  async verifyToken(token) {
    try {
      return await this.verifyTokenBreaker.fire(token);
    } catch (error) {
      if (error.message === 'Circuit breaker is open') {
        // Fallback behavior - perhaps use cached data or return limited access
        console.warn('Auth service unavailable, using fallback');
        return { valid: false, reason: 'service_unavailable' };
      }
      throw error;
    }
  }
}

// Usage in your user service
const authClient = new AuthClient();

app.middleware('/api/users', async (req, res, next) => {
  const token = req.headers.authorization?.replace('Bearer ', '');
  if (!token) {
    return res.status(401).json({ error: 'No token provided' });
  }

  try {
    const authResult = await authClient.verifyToken(token);
    if (!authResult.valid) {
      return res.status(401).json({ error: 'Invalid token' });
    }
    req.user = authResult.user;
    next();
  } catch (error) {
    console.error('Auth verification failed:', error);
    res.status(500).json({ error: 'Authentication service error' });
  }
});
Asynchronous Communication becomes essential for operations that don’t need immediate responses. Here’s how to implement event-driven communication using message queues:
// event-publisher.js - Publishing events for async processing
const amqp = require('amqplib');

class EventPublisher {
  constructor() {
    this.connection = null;
    this.channel = null;
  }

  async connect() {
    try {
      this.connection = await amqp.connect(process.env.RABBITMQ_URL);
      this.channel = await this.connection.createChannel();

      // Declare exchanges
      await this.channel.assertExchange('user.events', 'topic', { durable: true });

      console.log('Connected to message broker');
    } catch (error) {
      console.error('Failed to connect to message broker:', error);
      throw error;
    }
  }

  async publishUserEvent(eventType, userData) {
    if (!this.channel) {
      throw new Error('Not connected to message broker');
    }

    const event = {
      eventType,
      timestamp: new Date().toISOString(),
      data: userData,
      source: 'user-service',
      version: '1.0'
    };

    const routingKey = `user.${eventType}`;

    await this.channel.publish(
      'user.events',
      routingKey,
      Buffer.from(JSON.stringify(event)),
      {
        persistent: true,
        messageId: `${Date.now()}-${Math.random()}`,
        timestamp: Date.now()
      }
    );

    console.log(`Published event: ${routingKey}`, event);
  }

  async close() {
    if (this.channel) await this.channel.close();
    if (this.connection) await this.connection.close();
  }
}

// Usage in user service
const eventPublisher = new EventPublisher();

// Update user endpoint with event publishing
app.put('/api/users/:id', async (req, res) => {
  try {
    const userIndex = users.findIndex(u => u.id === parseInt(req.params.id));
    if (userIndex === -1) {
      return res.status(404).json({ error: 'User not found' });
    }

    const oldUser = users[userIndex];
    users[userIndex] = { ...oldUser, ...req.body, updatedAt: new Date().toISOString() };

    // Publish event for other services to consume
    await eventPublisher.publishUserEvent('updated', {
      userId: users[userIndex].id,
      changes: req.body,
      previousData: oldUser
    });

    res.json(users[userIndex]);
  } catch (error) {
    console.error('Error updating user:', error);
    res.status(500).json({ error: 'Failed to update user' });
  }
});
3. Data Management
- Database per Service: Each microservice should own its data
- Event Sourcing: Capture all changes as events
- CQRS: Separate read and write models
Here’s an example of implementing database-per-service pattern:
// database.js - Service-specific database connection
const { Pool } = require('pg');

class UserDatabase {
  constructor() {
    this.pool = new Pool({
      host: process.env.DB_HOST,
      port: process.env.DB_PORT,
      database: process.env.DB_NAME,
      user: process.env.DB_USER,
      password: process.env.DB_PASSWORD,
      max: 20,
      idleTimeoutMillis: 30000,
      connectionTimeoutMillis: 2000,
    });
  }

  async findById(id) {
    const query = 'SELECT * FROM users WHERE id = $1 AND deleted_at IS NULL';
    const result = await this.pool.query(query, [id]);
    return result.rows[0];
  }

  async create(userData) {
    const query = `
      INSERT INTO users (name, email, created_at)
      VALUES ($1, $2, NOW())
      RETURNING *
    `;
    const result = await this.pool.query(query, [userData.name, userData.email]);
    return result.rows[0];
  }

  async update(id, userData) {
    const query = `
      UPDATE users
      SET name = COALESCE($2, name),
          email = COALESCE($3, email),
          updated_at = NOW()
      WHERE id = $1 AND deleted_at IS NULL
      RETURNING *
    `;
    const result = await this.pool.query(query, [id, userData.name, userData.email]);
    return result.rows[0];
  }

  async close() {
    await this.pool.end();
  }
}

module.exports = UserDatabase;
4. Monitoring and Observability: Your Crystal Ball
In a monolith, when something breaks, you usually know where to look. With microservices, a user complaint about “slow checkout” could involve five different services, three databases, and two external APIs. This is where observability becomes your crystal ball, letting you see inside your distributed system.
I remember debugging a mysterious performance issue where checkout was taking 30 seconds instead of the usual 3. The logs showed everything was fine, but users were angry. It wasn’t until we implemented distributed tracing that we discovered our recommendation service was making 47 database queries for each product suggestion. The service was technically working, but it was creating a bottleneck that rippled through the entire system.
# prometheus-config.yaml - Complete monitoring setup
apiVersion: v1
kind: ConfigMap
metadata:
  name: prometheus-config
data:
  prometheus.yml: |
    global:
      scrape_interval: 15s
      evaluation_interval: 15s

    rule_files:
      - "alert_rules.yml"

    scrape_configs:
      - job_name: 'kubernetes-pods'
        kubernetes_sd_configs:
          - role: pod
        relabel_configs:
          - source_labels: [__meta_kubernetes_pod_annotation_prometheus_io_scrape]
            action: keep
            regex: true
          - source_labels: [__meta_kubernetes_pod_annotation_prometheus_io_path]
            action: replace
            target_label: __metrics_path__
            regex: (.+)
          - source_labels: [__address__, __meta_kubernetes_pod_annotation_prometheus_io_port]
            action: replace
            regex: ([^:]+)(?::\d+)?;(\d+)
            replacement: $1:$2
            target_label: __address__

      - job_name: 'user-service'
        static_configs:
          - targets: ['user-service:80']
        metrics_path: '/metrics'
        scrape_interval: 10s

  alert_rules.yml: |
    groups:
      - name: user-service-alerts
        rules:
          - alert: HighErrorRate
            expr: rate(http_requests_total{status=~"5.."}[5m]) > 0.1
            for: 2m
            labels:
              severity: warning
            annotations:
              summary: "High error rate detected"
              description: "Error rate is {{ $value }} requests/sec"

          - alert: HighResponseTime
            expr: histogram_quantile(0.95, rate(http_request_duration_seconds_bucket[5m])) > 0.5
            for: 5m
            labels:
              severity: critical
            annotations:
              summary: "High response time detected"
              description: "95th percentile response time is {{ $value }}s"
---
apiVersion: apps/v1
kind: Deployment
metadata:
  name: prometheus
spec:
  replicas: 1
  selector:
    matchLabels:
      app: prometheus
  template:
    metadata:
      labels:
        app: prometheus
    spec:
      containers:
      - name: prometheus
        image: prom/prometheus:latest
        ports:
        - containerPort: 9090
        volumeMounts:
        - name: config-volume
          mountPath: /etc/prometheus
        args:
          - '--config.file=/etc/prometheus/prometheus.yml'
          - '--storage.tsdb.path=/prometheus'
          - '--web.console.libraries=/etc/prometheus/console_libraries'
          - '--web.console.templates=/etc/prometheus/consoles'
          - '--storage.tsdb.retention.time=168h'
          - '--web.enable-lifecycle'
      volumes:
      - name: config-volume
        configMap:
          name: prometheus-config
Add metrics to your user service:
// metrics.js - Application metrics
const promClient = require('prom-client');

// Create metrics
const httpRequestDuration = new promClient.Histogram({
  name: 'http_request_duration_seconds',
  help: 'Duration of HTTP requests in seconds',
  labelNames: ['method', 'route', 'status_code'],
  buckets: [0.1, 0.3, 0.5, 0.7, 1, 3, 5, 7, 10]
});

const httpRequestsTotal = new promClient.Counter({
  name: 'http_requests_total',
  help: 'Total number of HTTP requests',
  labelNames: ['method', 'route', 'status_code']
});

const activeConnections = new promClient.Gauge({
  name: 'active_connections',
  help: 'Number of active connections'
});

// Register default metrics
promClient.register.registerMetric(httpRequestDuration);
promClient.register.registerMetric(httpRequestsTotal);
promClient.register.registerMetric(activeConnections);

// Middleware to track metrics
function metricsMiddleware(req, res, next) {
  const start = Date.now();

  res.on('finish', () => {
    const duration = (Date.now() - start) / 1000;
    const route = req.route?.path || req.path;

    httpRequestDuration
      .labels(req.method, route, res.statusCode)
      .observe(duration);

    httpRequestsTotal
      .labels(req.method, route, res.statusCode)
      .inc();
  });

  next();
}

// Metrics endpoint
function metricsEndpoint(req, res) {
  res.set('Content-Type', promClient.register.contentType);
  res.end(promClient.register.metrics());
}

module.exports = {
  metricsMiddleware,
  metricsEndpoint,
  httpRequestDuration,
  httpRequestsTotal,
  activeConnections
};
This monitoring setup gives you three levels of insight: metrics tell you what’s happening, logs tell you what went wrong, and traces tell you where it went wrong. Think of it like having a fitness tracker for your application - you get the high-level health metrics, but you can also drill down to see exactly which services are struggling.
Security Considerations
Service Mesh with Istio
Implement zero-trust security with service mesh:
# istio-security.yaml
apiVersion: security.istio.io/v1beta1
kind: PeerAuthentication
metadata:
  name: default
  namespace: production
spec:
  mtls:
    mode: STRICT
---
apiVersion: security.istio.io/v1beta1
kind: AuthorizationPolicy
metadata:
  name: user-service-authz
  namespace: production
spec:
  selector:
    matchLabels:
      app: user-service
  rules:
  - from:
    - source:
        principals: ["cluster.local/ns/production/sa/api-gateway"]
  - to:
    - operation:
        methods: ["GET", "POST", "PUT", "DELETE"]
        paths: ["/api/users*", "/health"]
Secret Management
# secrets.yaml
apiVersion: v1
kind: Secret
metadata:
  name: user-service-secrets
type: Opaque
data:
  database-url: <base64-encoded-value>
  api-key: <base64-encoded-value>
  jwt-secret: <base64-encoded-value>
---
apiVersion: v1
kind: ServiceAccount
metadata:
  name: user-service-account
  annotations:
    eks.amazonaws.com/role-arn: arn:aws:iam::ACCOUNT:role/user-service-role
Deployment Strategies
Rolling Updates
Kubernetes supports zero-downtime deployments:
# deployment-strategy.yaml
spec:
  strategy:
    type: RollingUpdate
    rollingUpdate:
      maxSurge: 1
      maxUnavailable: 0  # Ensure zero downtime
  template:
    spec:
      containers:
      - name: user-service
        image: your-registry/user-service:1.1.0
        # ...existing configuration...
        readinessProbe:
          httpGet:
            path: /health
            port: 3000
          initialDelaySeconds: 5
          periodSeconds: 5
          successThreshold: 2  # Require multiple successful checks
Blue-Green Deployments
Use tools like Argo Rollouts for advanced deployment strategies:
# blue-green-rollout.yaml
apiVersion: argoproj.io/v1alpha1
kind: Rollout
metadata:
  name: user-service-rollout
spec:
  replicas: 5
  strategy:
    blueGreen:
      activeService: user-service-active
      previewService: user-service-preview
      autoPromotionEnabled: false
      scaleDownDelaySeconds: 30
      prePromotionAnalysis:
        templates:
        - templateName: success-rate
        args:
        - name: service-name
          value: user-service-preview
      postPromotionAnalysis:
        templates:
        - templateName: success-rate
        args:
        - name: service-name
          value: user-service-active
  selector:
    matchLabels:
      app: user-service
  template:
    metadata:
      labels:
        app: user-service
    spec:
      containers:
      - name: user-service
        image: your-registry/user-service:1.1.0
        # ...existing configuration...
Performance Optimization
Horizontal Pod Autoscaling
# hpa.yaml
apiVersion: autoscaling/v2
kind: HorizontalPodAutoscaler
metadata:
  name: user-service-hpa
spec:
  scaleTargetRef:
    apiVersion: apps/v1
    kind: Deployment
    name: user-service
  minReplicas: 2
  maxReplicas: 10
  metrics:
  - type: Resource
    resource:
      name: cpu
      target:
        type: Utilization
        averageUtilization: 70
  - type: Resource
    resource:
      name: memory
      target:
        type: Utilization
        averageUtilization: 80
  behavior:
    scaleDown:
      stabilizationWindowSeconds: 300
      policies:
      - type: Percent
        value: 10
        periodSeconds: 60
    scaleUp:
      stabilizationWindowSeconds: 60
      policies:
      - type: Percent
        value: 100
        periodSeconds: 15
      - type: Pods
        value: 2
        periodSeconds: 60
Complete Deployment Script
Here’s a script to deploy everything:
#!/bin/bash
# deploy.sh - Complete deployment script

set -e

NAMESPACE="production"
IMAGE_TAG=${1:-"latest"}
REGISTRY="your-registry"
SERVICE_NAME="user-service"

echo "Deploying $SERVICE_NAME:$IMAGE_TAG to $NAMESPACE"

# Create namespace if it doesn't exist
kubectl create namespace $NAMESPACE --dry-run=client -o yaml | kubectl apply -f -

# Apply secrets (ensure these exist)
kubectl apply -f secrets.yaml -n $NAMESPACE

# Apply configurations
kubectl apply -f user-service-deployment.yaml -n $NAMESPACE
kubectl apply -f prometheus-config.yaml -n $NAMESPACE
kubectl apply -f hpa.yaml -n $NAMESPACE

# Wait for deployment to be ready
echo "Waiting for deployment to be ready..."
kubectl rollout status deployment/$SERVICE_NAME -n $NAMESPACE --timeout=300s

# Run smoke tests
echo "Running smoke tests..."
kubectl run curl-test --image=curlimages/curl --rm -i --restart=Never -n $NAMESPACE -- \
  curl -f http://$SERVICE_NAME/health

echo "Deployment completed successfully!"

# Show status
kubectl get pods -l app=$SERVICE_NAME -n $NAMESPACE
kubectl get svc $SERVICE_NAME -n $NAMESPACE
Conclusion
Building scalable microservices with Kubernetes and Docker requires careful planning and adherence to best practices. Key takeaways:
- Start with a monolith and extract services as needed
- Invest in observability from day one
- Automate everything - testing, building, and deployment
- Design for failure - implement circuit breakers and retry logic
- Security should be built-in, not bolted-on
The microservices journey is complex but rewarding. With proper tooling and practices, you can build systems that scale to millions of users while maintaining developer productivity.
The Journey Ahead
Building microservices with Kubernetes and Docker isn’t just about technology - it’s about changing how your organization thinks about software development. I’ve seen teams transform from shipping updates quarterly to deploying multiple times per day, and I’ve also seen teams get lost in the complexity and wish they’d stayed with their monolith.
The key is understanding that microservices are a tool, not a goal. They solve specific problems around team scaling, technology diversity, and independent deployment, but they introduce new challenges around service communication, data consistency, and operational complexity. Start with a monolith, identify the pain points, and extract services strategically.
Your first microservice will feel overwhelming. You’ll question whether the added complexity is worth it. That’s normal. By your fifth service, you’ll start to see the patterns. By your tenth, you’ll wonder how you ever built software any other way. The transformation isn’t just in your architecture - it’s in your team’s ability to move fast and ship with confidence.
The microservices journey is complex, but it’s also incredibly rewarding. With the right approach and tools, you can build systems that not only scale to millions of users but also scale with your organization as it grows. And isn’t that what great software architecture is really about?
Further Reading
- Kubernetes Official Documentation
- Docker Best Practices
- Microservices Patterns by Chris Richardson
- Building Microservices by Sam Newman
Have questions about microservices architecture or Kubernetes deployment strategies? Feel free to reach out - I’d love to discuss your specific use case!

Aaron Mathis
Systems administrator and software engineer specializing in cloud development, AI/ML, and modern web technologies. Passionate about building scalable solutions and sharing knowledge with the developer community.
Related Articles
Discover more insights on similar topics


